

Introduction
Methods
1. Data and resources
2. Description of study site
3. Genetic resource
4. GHG mitigation scenarios
5. Effective population size (Ne)
6. Inbreeding rate (Δ𝑓)
7. Off-take rate
8. Estimation of GHG emissions
9. Estimation of CH4 emissions
Results and Discussion
1. Dairy farming in the study area
2. Exotic genetic resources
3. Off-take of indigenous cattle
4. Changes in cattle stocks and breed composition
5.Effective cattle population size (Ne) and inbreeding rate (Δf)
6. Impacts of scenarios on GHG emission
7. Dairy farming for sustainability
Conclusion
Introduction
Greenhouse gas (GHG) emissions from agriculture, particularly livestock, are a major contributor to global warming, with livestock accounting for approximately 12% of all human-made GHG emissions (FAO, 2023). The CH4, a potent GHG with a global warming potential 28 to 36 times greater than carbon dioxide, makes up the largest share of emissions from the dairy sector, primarily resulting from enteric fermentation in cattle (Hailemiriam, 2018). Recognizing the urgent need for mitigation, global initiatives such as the Dairy CH4 Action Alliance, formed at the 28th United Nations Climate Change Conference, are spearheading efforts to reduce emissions through innovation and collaboration (Harvey, 2023; EDF, 2023).
Ethiopia, with its diverse agricultural systems and reliance on indigenous cattle breeds, faces unique challenges in balancing dairy production with environmental sustainability. The agricultural sector contributes nearly 70% of Ethiopia’s total GHG emissions, with indigenous cattle disproportionately responsible due to low productivity and inefficient feeding practices (Hailemiriam, 2018). Additionally, climate change exacerbates these challenges, as extreme weather events, reduced pasture availability, and heat stress in cattle threaten the sustainability of Ethiopia’s pastoral and agro-pastoral systems (Tegegne et al., 2013; Hailemiriam, 2018). Droughts and floods, for instance, have already reduced pasture availability, sometimes decreasing milk production by as much as 38% (Lamesegn, 2018).
Addressing these challenges requires a multifaceted approach. Strategies such as improving feed quality, adopting better manure management practices, and transitioning to high-performance breeds hold significant potential. Replacing low-performance indigenous cattle with genetically improved breeds could enhance milk productivity while reducing GHG emissions per liter of milk produced (Bayssa et al., 2021). This paper explores the intersection of climate change, dairy farming, and GHG emissions in Ethiopia, emphasizing strategies to enhance productivity and ensure environmental sustainability.
Introducing high-performance dairy cattle to Ethiopia offers opportunities to mitigate GHG emissions but also presents challenges. Exotic breeds, such as Holstein, often require more feed and water, which may strain Ethiopia’s limited resources, especially under climate variability (Bayssa et al., 2021). Furthermore, these breeds may face adaptation challenges to Ethiopia’s environment, potentially reducing productivity (Bayssa et al., 2021). To address these limitations, genetic improvement strategies are being explored, focusing on combining the resilience of indigenous cattle with the productivity of exotic breeds through advanced techniques such as artificial insemination (AI) and embryo transfer (ET) (Bayssa et al., 2021; FAO, 2004).
In the past, breeding programs relied primarily on phenotypic selection of breeding bulls. However, advancements in information processing technology, particularly through AI, have revolutionized the accuracy of Estimated Breeding Values (EBV) by efficiently handling large datasets (Weigel, 2001). Although AI for reproduction has enabled genetic improvement across entire populations using a small number of breeding bulls, it increases the likelihood of inbreeding, as related individuals are selected simultaneously (Weigel, 2001). This trend also reduces the effective population size (Ne), diminishing genetic diversity and raising risks of inbreeding rate (Δf) (FAO, 2004). Therefore, sustainable livestock development projects must consider biodiversity and promote a balance between natural breeding and AI application.
Effective population size (Ne) of animal is critical for maintaining its genetic diversity. Breeding experts have recommended a male-to-female ratio of 20-30:1 in breeding programs, which ensures optimal breeding efficiency and minimizes inbreeding (FAO, 2004). Methods such as Wright’s equation and Falconer’s equation are widely used for estimating Ne. Wright’s equation (Wright, 1931) emphasizes the ratio of breeding males to females, while Falconer’s equation accounts for genetic variation across generations, highlighting the importance of maintaining genetic diversity and sustainability.
Additionally, sustainable livestock management practices, including improving feed efficiency through high-quality feed and additives, adopting proper manure management techniques like anaerobic digestion, and rotational grazing, can significantly reduce the carbon footprint of dairy farming (Dacey, 2021; FAO, 2023). Integrating livestock with crop production systems further enhances soil health and sequesters carbon, offsetting emissions (Dacey, 2021). Innovative approaches such as enhanced weathering with basalt hold promise by capturing atmospheric CO2 as bicarbonate in soils, improving soil health, and supporting robust plant growth (Dacey, 2021). Such holistic measures are essential for achieving sustainable agriculture.
This study evaluates the potential of introducing high-performance dairy cattle to Ethiopia as a strategy to improve milk productivity and reduce GHG emissions. By combining genetic improvements, sustainable livestock practices, and international cooperation, Ethiopia’s dairy sector can align its agricultural strategies with global climate change goals while fostering environmental and economic sustainability.
Methods
1. Data and resources
Data collection was conducted during an on-site investigation in Ethiopia from February 28th to March 5th, 2023. These investigations involved official meetings with key stakeholders in the dairy sector, including the Ministry of Agriculture (MoA), Livestock Development Institutes (LDI), Ethiopia Institute for Agricultural Research (EIAR), and Agriculture Transforming Agency (ATA). Field visits and surveys were conducted with the dairy cooperatives in Bishoftu town and Ada’a district, engaging local dairy farmers. Data on dairy management practices, barn structures, feedstuff, milk production, and financial operations were collected. The World Bank and the Netherlands Development Organization (SNV) supported survey design and logistics.
2. Description of study site
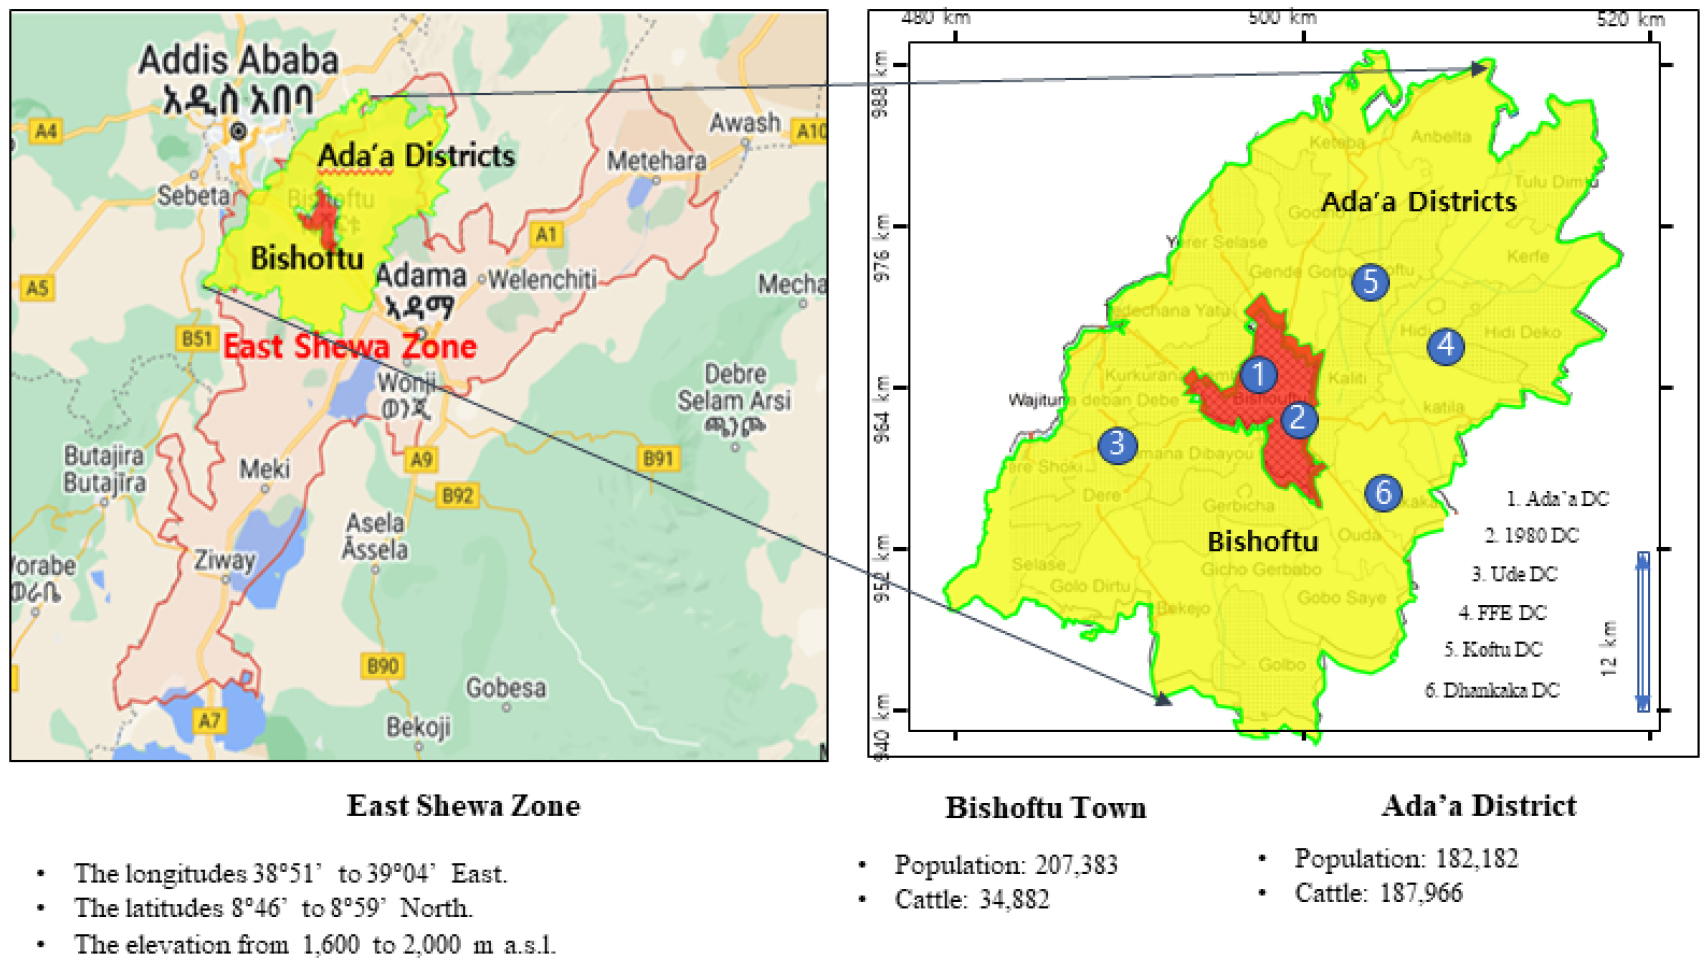
The study covers the Bishoftu town and Ada’a district in the East Shewa Zone of the Central-East Oromia. Ada’a District, covering 894.4 km², has a population of 182,182, while Bishoftu Town, spanning 40.01 km², has 207,383 residents. The study area, situated between longitudes 38°51' to 39°04' East and latitudes 8°46' to 8°59' North, experiences a subtropical climate with temperatures ranging from 8°C to 28°C and annual rainfall averaging 860 mm during the short rainy season (Alemayehu et al., 2012). A location map of the study area, originally drawn by Park et al. (2023), was modified and is presented in Figure 1. The GHG parameters associated with Ethiopia’s dairy production system are summarized in Table 1.
3. Genetic resource
This project introduces high-performance exotic breeds via AI and ET. Totally, 10,000 straws of sexed Korean Holstein Friesian (KHF) semen and 1,000 KHF embryos are expected to distribute during five years of project period. The goal is a 50% genetic contribution from KHF cattle in crossbreeding with indigenous breeds (IB) and a 75% contribution from crossbreds (CB).
Table 1.
The important parameters of different dairy production systems.
| Parameter | Unit | Holstein | References | Ethiopia Dairy Production System | References | |||
| PAP">† | MCL | SID | CID | |||||
| Head of Cattle | Million head | 0.38 | www.naknong.or.kr | 13.45 | 55.3 | 1.86 | Li et al., 2023. | |
| Milking cows (%) | 79.89 | 39.55 | 30.2 | 48.92 | ||||
| MBW§ | Kg/head |
751 (601-991) | www.nias.go.kr |
242 (162-323) |
242 (162-323) |
550 (425-675) | ||
| AMP§§ | Million ton | 1.93 | https://kosis.kr | 1.41 | 2.84 | 1.34 | ||
| Enteric CH4 emission | Gg of CH4/head/year | 52.82 | Authors‡ | 520 | 2,517 | 33 | 73 | Wassie et al., 2023 (data of 2018) |
| GE§§§ | MJ/head/day | 365 | Ibidhi et al., 2021 (over 2 years) | 70.99 (non-dairy IB) 87.00 (dairy CB)_ | Tadesse et al., 2022 (over 2 years) | |||
| Conversion rate of CH4 | Ym (%)*** | 5.8 | 6.5*** | |||||
| EF* | Kg/head/year | 139 | 49.4±0.92 | 47.7±0.54 | 54.9±1.49 | 50.9±1.32 | Wassie et al., 2023 | |
| EI** | Milk (L) | 1.70 | Capper et al., 2020 | 18.64 | 13.02 | 4.62 | Berhe et al., 2020 | |
Notes:†PAP: pastoral and agro-pastoral; MCL: mixed crop-livestock; SID: smallholder intensive dairy; CID: commercial intensive dairy;‡The amount of enteric CH4 emission by dairy cattle, in Korean Holstein is calculated by EF (139 kg/head/year) × total Holstein number (0.38 million head); §Matured body weight; §§ Annual milk production; §§§ Gross energy is calculated in MJ/head/year is based on the sum of net energy available in the diet for maintenance, activity, lactation, and pregnancy to digestible energy consumed, and net energy for growth to digestible energy consumed (IPCC, 2019). 70.99 for non-dairy indigenous breed (IB), 87.00 for female of corssbred (CB) (Tadesse et al., 2022); *EF= Emission factor for enteric CH4/head/year, EF = {GE (MJ/head/day)×(Ym/100)×365/day/year}/55.65 (MJ/kg CH4); **Emission intensity; the GHG (kg CO2-eq.) emitted per 1 L of milk in this study. It essentially reflects how efficiently emissions are managed relative to the activities or processes causing them; ***Ym (%): CH4 conversion factor; 6.5% = CH4 (kcal)/GE (kcal) of the femae cattle over 2 years of non-dairy IB and dairy CB (Tadesse et al., 2022).
4. GHG mitigation scenarios
Two GHG mitigation scenarios are designed to evaluate the impact of milk productivity improvement in indigenous cattle through the introduction of exotic cattle genetic resources, and to compare this with the effect of optimizing cattle population size by off-taking indigenous breeds.
Scenario 1 (Input of improved genetic resources): Retains indigenous cows as dams to receive improved genetic resources from exotic cattle.
Scenario 2 (Off-Take of indigenous cattle): For efficient cattle population in dairy farm, off-takes low-milk performance cows and males of indigenous cattle that are non-essential for breeding or draught power.
5. Effective population size (Ne)
The concept of Ne is adequate for large, specialized breeding farms but not for ordinary milking or fattening farms. However, we assumed the study area as one cattle community because breeding bulls are moved to neighboring farms to mate. The number of indigenous breeding bulls can be kept as low as possible to spread superior genetic resources efficiently.
The Ne can be calculated using Wright’s (1931) or Falconer’s (1989) formulas: Ne or Ne.
The minimum Ne is a measure used in population genetics to estimate the number of individuals in a population that contribute to the next generation. It’s important for understanding genetic diversity and the potential for inbreeding. The minimum Ne value can vary depending on the species and context, but for many populations, Ne values are typically in the range of 50-500 individuals
6. Inbreeding rate (Δ𝑓)
The inbreeding rate (Δ𝑓) can be obtained by .
The ideal inbreeding rate (Δf) for cattle breeds typically aims to be as low as possible to minimize inbreeding depression, which can negatively affect reproductive performance, growth rates, and overall health. Generally, an inbreeding rate of less than 1% per generation is considered acceptable and manageable in cattle breeding programs.
7. Off-take rate
The commercial off-take rate can be estimated using the formula:
Commercial off-take rate=(Ns×100)/0.5×(opening stock+ending stock)
Where Ns is the number of sold cattle, opening stock refers to the cattle numbers at the beginning of the year, and ending stock refers to the cattle numbers at the end of the year.
8. Estimation of GHG emissions
To estimate farm-based GHG emissions, Tezera (2018) suggested a value of 26,406 kg CO2-eq./farm was applied to 11,809 non-member holders and 781 member holders. At the endline of four years later, GHG emissions for 2,000 member holders (including new members) are projected to drop to 19,510 kg CO2-eq./farm.
To calculate annual GHG emissions per cattle, The values of Tezera (2018) were applied: 2,105 kg CO2-eq./lactating cow, 493 kg CO2-eq./youngstock (heifers and calves), and 937 kg CO2-eq./male cattle for peri-urban farms; and 2,967 kg CO2-eq./lactating cow, 600 kg CO2-eq./youngstock, and 289 kg CO2-eq./male cattle for urban farms. These values were used to estimate emissions for 13,824 cattle by grouping them into lactating cows, youngstock, and male cattle.
9. Estimation of CH4 emissions
Using a value of Tezera (2018), 23,206 kg CO2-eq./farm was applied to each non-member and member farm. At the endline of four years later, the emissions for 2,000 member farms are expected to decrease to 14,054 kg CO2-eq./farm. CH4 emissions were also calculated for 13,824 cattle using emission factors (EFs) specific to Ethiopia milk production systems: 18.6 and 3.12 kg/head/year for the pastoral production system, 13.02 and 2.16 kg/head/year for the mixed crop-livestock production system, and 4.62 and 1.74 kg/head/year for the urban production system (Berhe et al., 2020). The calculated emissions were further broken down by cattle growth stage and breed (indigenous, crossbreeds, exotic) using IPCC guidelines (2019).
GHG and CH4 emissions were estimated using various parameters, including emission efficiency factors (EFs), CO2 conversion factors of CH4 (Ym), and emission intensities (EI) (Tezera, 2018; Berhe et al., 2020; Capper et al., 2020; Hailemiriam, 2018). Calculations were categorized by cattle groups and breeds, specifically targeting milking cows, heifers, calves, and breeding male cattle in Bishoftu town and Ada’a district.
Table 2.
Number of cattle stocks and milk production in East Shewa Zone.
| Geographic Area | Nation | Oromia Region | East Shewa Zone | ||||||||
| Category | Head | % | Head | % | Head | % | |||||
| Cattle number | Total | 70,291,776 | 100.00 | 26,808,797 | 100.00 | 1,095,554 | 100.00 | ||||
| Male | 30,772,193 | 43.31 | 12,144,144 | 45.30 | 565,790 | 51.64 | |||||
| Female | 39,519,583 | 56.69 | 14,664,653 | 54.70 | 529,764 | 48.36 | |||||
| Breeds | Total | 70,291,776 | 100.00 | 26,808,797 | 100.00 | 1,095,554 | 100.00 | ||||
| Indigenous | Male | 30,086,416 | 42.80 | 11,767,803 | 43.90 | 559,642 | 51.08 | ||||
| Female | 38,376,901 | 54.60 | 14,135,539 | 52.73 | 524,670 | 47.89 | |||||
| Crossbred | Male | 612,659 | 0.87 | 337,679 | 1.26 | 3,580 | 0.33 | ||||
| Female | 997,227 | 1.42 | 486,965 | 1.82 | 3,261 | 0.30 | |||||
| Exotic | Male | 73,117 | 0.10 | 38,662 | 0.14 | 2,569 | 0.23 | ||||
| Female | 145,455 | 0.21 | 42,149 | 0.16 | 1,832 | 0.17 | |||||
| Cattle holding size (holders) | Total | 14,226,913 | 100.00 | 5,689,803 | 100.00 | 213,998 | 100.0 | ||||
| <4 | 9,455,864 | 66.46 | 3,471,391 | 61.01 | 114,700 | 53.60 | |||||
| 5 - 9 | 3,636,422 | 25.56 | 1,699,816 | 29.87 | 78,174 | 36.53 | |||||
| 10 - 49 | 1,097,953 | 7.72 | 516,089 | 9.07 | 21,124 | 9.87 | |||||
| 50 - 100 | 28,955 | 0.20 | 1,925 | 0.03 | 0 | 0.00 | |||||
| >100 | 7,719 | 0.05 | 582 | 0.01 | 0 | 0.00 | |||||
|
Holding purpose (over 3 to under 10 years) | Total | 42,445,683 | 60.38 | 15,678,024 | 100.00 | 687,299 | 100.00 | ||||
| Milk | 7,556,402 | 10.75 | 2,734,395 | 17.44 | 78,957 | 11.49 | |||||
| Draught | M | 15,409,583 | 21.92 | 6,455,161 | 41.17 | 371,216 | 54.01 | ||||
| F | 243,436 | 0.35 | 13,240 | 0.08 | - | 0.00 | |||||
| Beef | M | 680,262 | 0.97 | 303,663 | 1.94 | - | 0.00 | ||||
| F | 178,174 | 0.25 | 28,559 | 0.18 | - | 0.00 | |||||
| Breeding | M | 1,801,644 | 2.56 | 310,740 | 1.98 | 17,457 | 2.54 | ||||
| F | 15,559,113 | 22.14 | 5,542,663 | 35.35 | 216,385 | 31.48 | |||||
| Other | M | 392,544 | 0.56 | 120,990 | 0.77 | 3,253 | 0.47 | ||||
| F | 624,324 | 0.89 | 168,613 | 1.08 | - | 0.00 | |||||
| Milk producing cows* | Total | 22,598,088 | 32.15 | 7,788,743 | 100.00 | 237,064 | 100.0 | ||||
| Dairy cow | 7,556,402 | 10.75 | 2,696,130 | 34.62 | 78,957 | 33.31 | |||||
| Milking cow | 15,041,686 | 21.40 | 5,092,613 | 65.38 - | 158,107 | 66.69 | |||||
| Milk productivity** | DMP/cow | 1.48 | 1.37 | 1.87 | |||||||
| Nation’s AMP | 4.692,994 | 147,404 | 63,906 | ||||||||
| Breeding*** | Ratio of male to female (Nm/Nf) | 0.116 | 0.006 | 0.081 | |||||||
| Effective population size(Ne) | 6,015,156.47 | 15,571,141.28 | 674,702.00 | ||||||||
| Inbreeding rate (∆f) | 8.31 × 10⁻⁸ | 3.21 × 10⁻⁸ | 7.41 × 10⁻⁷ | ||||||||
Notes: *Dairy cow means any type of cow used to give milk previously, and/or provide milk currently or have never given milk before and pregnant now. Milking cow means cows actually milked during the year of survey; **DMP: Average daily milk production (L/day/cow); AMP: Annual milk production (×1,000 L/year); ***Ratio of male and female was calculated by the cattle over 3 to under 10 years: Ne={4×(Nm×Nf)}/(Nm+Nf) (Wright, 1931); inbreeding rate was estimated using equation of Ne.
Sources: Authors and CSA (2021).
Results and Discussion
1. Dairy farming in the study area
Among Ethiopia’s 70.3 million cattle, the Oromia Regional State is home to 40.46% (26.8 million head), making it a key area for dairy production and GHG emissions. Oromia accounts for 35% of Ethiopia’s total GHG emissions, with IB cattle comprising 90.40% of the cattle population. However, CB and exotic breed (EB) cattles make up only 2.29% (1.61 million head) and 0.31% (0.218 million head), respectively. In East Shewa Zone, the proportion of CB cattle is particularly low at 0.63%, while that of EB cattle is slightly higher at 0.40% (Table 2).
To mitigate GHG emissions and address feed deficiencies, the concept of Ne has been proposed. This involves reducing the breeding male-to-female ratio through the expanded use of AI. For instance, if the national Nm/Nf ratio of 0.116 were applied to the cattle aged 3 to under 10 years, the number of breeding males would decrease to 310,740 in Oromia and 17,457 in East Shewa Zone, significantly lowering GHG emissions while maintaining milk production levels. Despite these improvements, genetic diversity must be carefully managed, as Ne and Δf remain critical factors for sustainability.
In Bishoftu town and Ada’a district, 222,840 cattle are raised across farms with varying sizes and production systems (Table 3). According to the Ada’a district agriculture office, 13,824 cattle from 781 farms are being registered under six dairy cooperatives forming the Bishoftu-Guddina Dairy Union. These farms utilize 18 milk collection points and five milk collection centers to process 145,000 L of milk daily, with 90,000 L produced in Bishoftu and 55,000 L in Ada’a. However, if a private collector offers a higher price, many smallholder farms prefer to sell their milk informally. In a primary cairy cooperative sell milk during certain seasons to local milk processors at a lower price (KOICA, 2023). This underscores the need for structural improvements to integrate more farms into the formal supply chain.
Table 3.
The primary dairy cooperatives under Bishoftu-Guddina Dairy Union.
| Categories | Bishoftu town | Village in Ada’a district | |||||
| Wajitu | Hiddi | Koftu | Dhankaka | ||||
| Dairy cooperative (DC) | Name of DC | Ada’a DC | 1980 DC | Ude DC | FFE DC | Koftu DC | Dankaaka DC |
| Year established | 2020 | 1990 | 2020 | 2013 | 2004 | 2011 | |
| Assets (ETB†) | 50,000,000 | 2,000,000 | 140,070,417 | 400,000 | 200,000 | 3,000,000 | |
|
Registered farmers (No. of women) |
416 (208) |
85 (N/A) |
88 (22) |
56 (12) |
60 (22) |
76 (15) | |
| Number of cattle (head) | Regional total | 34,882 | 187,966 | ||||
| Total from member farms | 13,824 (Ave. 17.7 cattle per farm) | ||||||
| Breakdown by DC* | 7,363 | 1,505 | 1,558 | 991 | 1,062 | 1,345 | |
|
Milk** (L/day) | Produced by farm | 90,000 | 55,000 | ||||
| Received by DC | 70,000 | 42,000 | |||||
|
Milk collection *** | MCC | 1 | 1 | 1 | 1 | 1 | |
| MCP | 10 | 2 | 3 | 3 | 3 | 3 | |
Notes: *The number of cattle is estimated by dividing the total number of cattle by the number of registered farms; **The data on the amounts of milk yield and milk received are obtained from Ada’a District’s Agriculture Office (Kim et al, 2023); ***Milk collection centers (MCC) are operated within kebelles (5,000 ha per kebelle), which function as municipalities. Within each kebelle, milk collection points (MCP) are established in every three zones (2,000 ha per zone); however, not all zones have collection points; †ETB stands for Ethiopian Birr, the official currency of Ethiopia. As of the current exchange rate, 1 US dollar equals approximately 57.812 ETB
2. Exotic genetic resources
Introducing exotic high-performance breeds like the KHF holds significant potential for reducing GHG emissions in Ethiopia’s dairy sector. The higher milk productivity of KHF-IB crossbred cows reduces the need for a large cattle population, thereby lowering overall GHG emissions. By expanding the genetic improvement program to increase participating farms from 781 to 2,000, and by phasing out low-performance indigenous cattle including breeding bulls and milking cows.
This study explored two key scenarios:
Genetic Improvement Scenario (SCN 1): Indigenous milking cows served as dam cows for crossbreeding with KHF, resulting in a moderate reduction in herd size and enteric CH4 emissions.
Off-Take Scenario (SCN 2): This scenario featured the more extensive phasing out of indigenous cattle, achieving a significant reduction in enteric CH4 emissions by transforming breed composition in the herd.
Both scenarios demonstrate that even modest shifts toward high-yielding breeds can yield measurable environmental benefits. Additionally, integrating these genetic improvements with sustainable practices, such as rotational grazing, anaerobic manure management, and enhanced feed efficiency, can amplify mitigation efforts. For example, the introduction of basalt weathering to capture CO2 further underscores the potential for innovative solutions in Ethiopia’s dairy sector.
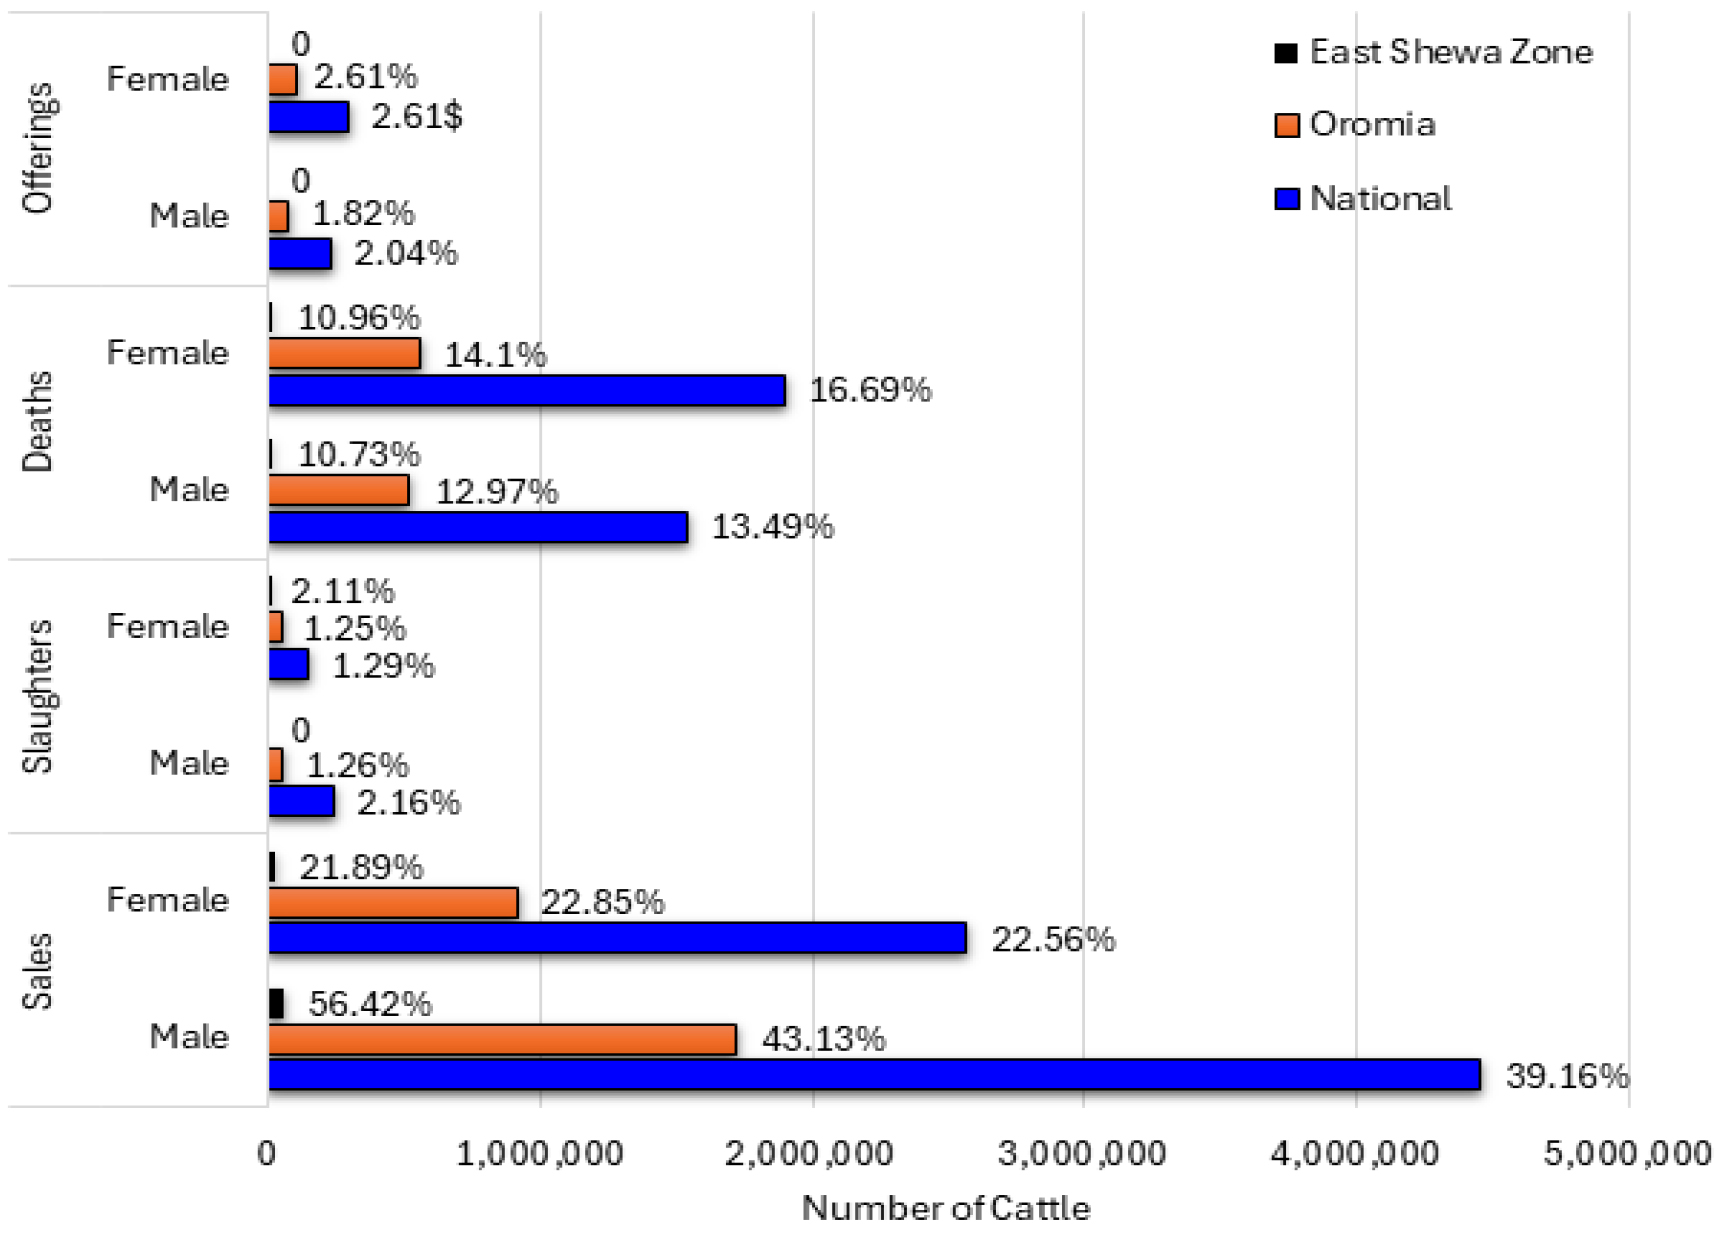
Figure 2.
Off-take numbers and ratios of male and female cattle in Ethiopia during 2019-2020 (Source: CSA, 2021).
The findings highlight the importance of adopting high-yielding breeds alongside strategies to improve sustainability in Ethiopia’s dairy farming. Coordinated efforts among farmers, researchers, and policymakers will be essential to achieving long-term environmental and economic benefits.
3. Off-take of indigenous cattle
In livestock farms, the fluctuation in the number of cattle can be attributed to various factors such as sales, death, offerings, slaughtering, transfers, exchange, gifts, and purchases. The annual average stock is determined based on the number of cattle at the beginning and end of the year, divided by two. According to Figure 2 from the 2019-2020 Ethiopian survey report of Central Statistics Agency (CSA, 2021), commercial off-take, which includes cattle sales for profit, had the highest proportion of changes. Nationally, this accounted for 61.73%, in Oromia Region for 65.98%, and the highest in East Shewa Zone at 78.31%.
The second highest factor was mortality, with an estimated 3.43 million head of cattle losses due to diseases, stillbirths, and natural disasters. Notably, the number of cattle offered as sacrifices due to religious influences (ca. 530,000 head) exceeded the number reduced by slaughtering (ca. 390,000 head). There were more males in commercial and slaughter-related reductions, while females were preferred for offerings.
However, it remains unclear whether these data pertain to draught males or breeding males that affect the Ne values. In East Shewa Zone, 78% of the reduction in the number of males was due to commercial sales and fall dead. Considering these fluctuations, a scenario was proposed and compared regarding the introduction of exotic genetic material to maintain milk production and reduce GHG emissions. This approach emphasizes the need to support the dissemination of exotic genetic resources to achieve these goals.
4. Changes in cattle stocks and breed composition
The distribution of 1,000 embryos and 10,000 straws of frozen semen from KHF genetic resources resulted in the reproduction of 7,050 calves. This included 665 purebred KHF calves (100% blood level), 618 KHF-IB crossbreds with a 75% blood level, and 5,767 KHF-IB crossbred with a 50% blood level. Table 4 summarizes the changes in cattle breed composition and breeding cattles under the two scenarios, without increasing the number of farms (12,590 farm).
Table 4.
Changes in breeding cattle stocks and breed composition in herd by adoption of two scenarios.
| Baseline | SCN 1 | SCN 2 | |||||
| Number | % | Number | % | Number | % | ||
| Farms* | Overall | 12,590 | 100.00 | 12,590 | 100.00 | 12,590 | 100.00 |
| Registered | 781 | 6.20 | 2,000 | 15.89 | 2,000 | 15.89 | |
| Non-registered | 11,809 | 93.80 | 10,500 | 84.11 | 10,500 | 84.11 | |
| Breed composition** | Overall | 13,824 | 100.00 | 20,849 | 100.00 | 10,051 | 100.00 |
| Indigenous breeds | 12,406 | 89.74 | 11,402 | 54.69 | 1,583 | 15.75 | |
| Cross breeds | 1,196 | 8.65 | 8,474 | 40.64 | 8,484 | 84.41 | |
| Exotic breeds | 222 | 1.61 | 973 | 4.67 | 974 | 9.69 | |
| Growth stage*** | Overall | 13,824 | 100.00 | 20,849 | 100.00 | 10,051 | 100.00 |
| Milking cows | 6,454 | 46.69 | 14,437 | 69.25 | 5,546 | 55.18 | |
| Breeding males | 3,603 | 26.06 | 625 | 3.00 | 486 | 4.84 | |
| Heifer | 1,859 | 13.45 | 3,613 | 17.33 | 2,348 | 23.36 | |
| Calf | 1,908 | 13.80 | 2,174 | 10.43 | 1,670 | 16.62 | |
| Cattle per farm | Overall | 17.70 | 10.42 | 5.03 | |||
| Milking cows | 8.26 | 7.22 | 2.77 | ||||
| Breeding males | 4.61 | 0.31 | 0.24 | ||||
| Heifer | 2.38 | 1.81 | 1.17 | ||||
| Calf | 2.44 | 1.09 | 0.84 | ||||
Notes: *The goals of the study, but not included draught male cattle number; **Data source of cattle breed: Oromia Regional State of Agriculture (KOICA, 2023); ***Estimated number are based on the average % of cattle growth stage (Berhe et al., 2019; Capper et al., 2020).
(1) Impact of genetic improvement in SCN 1
By SCN 1, the total number of cattle increased from 13,824 head to 20,849 head, with a rise in the proportion of crossbred and exotic breeds. Crossbred cattle made up 40.64%, compared to 8.65% in the baseline, while indigenous breeds decreased to 54.69%. The number of milking cows also saw significant growth, reaching 14,437 head (69.25% of total cattle), compared to 6,454 head (46.69%) in the baseline.
Despite these gains, GHG emissions increased due to the larger cattle population and low-milk productivity of indigenous breeds. This emphasizes the need to phase out low-performance indigenous cattle to optimize breed composition. Additionally, educating smallholder farmers on the benefits of adopting crossbred and pure Holstein breeds is essential. Factors such as education level, age, knowledge of improved feed, and training on dairy technology positively influenced the adoption rate of crossbred cattle in Oromia (Tesfaye et al., 2022).
Genetic improvement strategies aim to combine the adaptability and hardiness of indigenous breeds with the high milk production potential of exotic Bos taurus breeds (Azage et al., 2010; Kefena et al., 2011). For instance, a crossbred Arsi-Friesian cattle demonstrated a notable increase in milk yield, from 258 L over 179 days to 1,873 L over 492 days of lactation, in on-station studies (Kurtut et al., 1999). However, previous attempts to replace indigenous breeds with exotic cattle over 60 years have often failed to achieve the desired productivity levels due to environmental challenges (Chebo et al., 2012).
(2) Impact of breed composition in SCN 2
Under the off-take of indigenous cattle, SCN 2 focused on reducing the proportion of low-performance indigenous cattle by 87.24% (10,823 head). This resulted in a total cattle population of 10,051, with significant increases in crossbred (84.41%) and exotic (9.69%) breeds. This shift not only reduced enteric CH4 emissions but also improved milk production efficiency.
By transitioning to higher-yielding breeds, enteric CH4 emissions were significantly mitigated despite the smaller herd size. This demonstrates the potential for reducing emissions intensity while maintaining milk production. According to CSA (2021), data from 2019-2020 on livestock movements indicate that strategic off-take and replacement of cattle could further optimize economic value, productivity, and environmental outcomes. For instance, targeted breeding programs incorporating Ne and controlling Δ𝑓 would enhance genetic diversity and sustainability.
Both scenarios underline the importance of genetic improvement in reducing GHG emissions and enhancing dairy productivity. SCN 2, with its aggressive Off-Take strategy, showed greater potential for environmental impact mitigation. However, sustainability requires a balance between improving cattle productivity and maintaining genetic diversity. Integrating advanced breeding programs with sustainable livestock management practices can help maximize economic and environmental benefits for Ethiopia’s dairy sector.
5.Effective cattle population size (Ne) and inbreeding rate (Δf)
Two distinct approaches are utilized to phase out low-performance cattle: optimizing Ne for specialized breeding farms and applying commercial off-take rates. The commercial off-take rate considers the sale of animals but excludes slaughters, transfers, exchanges, gifts, and cattle purchases. Maintaining an effective cattle population size ensures genetic diversity and sustainable breeding programs. Falconer (1989) suggested optimal Ne values of 5.19 to 4.77 for farms at the time, but sustaining such low numbers of breeding females (Nf) poses risks for large- scale breeding operations under current conditions (Mijić et al., 2017). FAO (2004) recommended a male-to-female ratio of 20-30:1 in breeding programs to ensure optimal breeding efficiency and minimize inbreeding risks. In some studies, a ratio as high as 500:1 has also been suggested. In this study, we suggested the Ne values and Δf based on the data from the target area. Table 5 presents the appropriate levels based on the existing cattle numbers and Ne values, along with Δf of the study area.
Table 5.
Effective cattle population size (Ne) and inbreeding rate (Δf) before and after introducing KHF genetic materials.
| Region | Scenarios | Nm | Nf | Ne* | Δf** | ||
| Amhara† | Quara | 2.8 | 9.60 | 8.67 | 0.06 | ||
| Alefa | 1.20 | 3.33 | 3.53 | 0.14 | |||
| Oromia | Bishoftu Town & Ada’a District | Total Farm | Baseline | 3,603 | 6,454 | 9,248 | 0.00005 |
| SCN 1 | 625 | 14,437 | 8,335 | 0.00006 | |||
| SCN 2 | 486 | 5,546 | 1,787 | 0.00028 | |||
| Individual Farm | Baseline | 4.61 | 8.26 | 11.84 | 0.042 | ||
| SCN 1 | 0.31 | 7.22 | 1.20 | 0.42 | |||
| SCN 2 | 0.24 | 2.77 | 0.89 | 0.56 | |||
Notes: The effective cattle population size (Ne): 𝑁𝑒={4×(𝑁𝑚×𝑁𝑓)}/(𝑁𝑚+𝑁𝑓); 𝑁𝑚: the number of male cattle, 𝑁𝑓: the number of female cows; Δf: inbreeding rate (Wright, 1931); †Data source: The Ne and Δf can be exemplified in a study of the Alefa district in the North Gondar Zone of Amhara Regional State (Ayeneshet et al., 2017) as a reference; *The minimum effective population size (Ne) is a measure used in population genetics to estimate the number of individuals in a population that contribute to the next generation. It's important for understanding genetic diversity and the potential for inbreeding. The minimum Ne value can vary depending on the species and context, but for many populations, Ne values are typically in the range of 50-500 individuals; **The ideal inbreeding rate (Δf) for cattle breeds typically aims to be as low as possible to minimize inbreeding depression, which can negatively affect reproductive performance, growth rates, and overall health. Generally, an inbreeding rate of less than 1% per generation is considered acceptable and manageable in cattle breeding programs.
(1) Trends of the Ne and Δf
Table 5 illustrates the Ne and Δf across regions and scenarios before and after introducing KHF genetic materials. The minimum Ne estimates the number of individuals contributing genetically to the next generation, typically ranging from 50-500 head to ensure genetic diversity. Maintaining an Δf of less than 1% per generation is critical to avoid inbreeding depression, which negatively affects reproductive performance, growth, and health.
Extensive farming systems, such as those in Quara district in the lowlands of Amhara Region, exhibit higher Ne value (8.67) and lower Δf rate (0.06), attributed to 100% natural mating. In contrast, intensive systems like Alefa district in the midlands, utilizing 12% AI, show lower Ne value (3.53) and higher Δf rate (0.14) (Ayeneshet et al., 2017). At baseline, individual farms registered under cooperatives in Oromia demonstrated Ne values of 11.84 and Δf values of 0.042, comparable to those in the Alefa district
(2) Scenario analysis: changes of Ne and Δf values
After introducing KHF genetic materials via AI, the total Ne decreased from 9,248 head to 8,335 head under SCN 1 and to 1,787 head under SCN 2 for the whole population. For individual farms, Ne values dropped from 11.84 to 1.20 (SCN 1) and 0.89 (SCN 2). These reductions reflect selective breeding focused on improved productivity rather than maintaining higher population sizes. Despite decreases in Ne (0.00006 for SCN 1 and 0.00028 for SCN 2), the Δf values of 0.42 and 0.56 remained manageable in individual farm, respectively.
The high proportion of female cattle resulted from the retention of indigenous dams used for crossbreeding with KHF genetic resources. This balanced strategy minimized the impact of inbreeding while optimizing milk productivity and reducing low-performing cattle. Following FAO (2004) recommendations, a minimum Ne of 50 is necessary to preserve genetic diversity, as supported by studies on Danish Holstein (Sørensen et al., 2005) and African breeds (Maiwashe et al., 2006).
(3) Recommendations for sustainable dairy farming
Achieving sustainability requires reducing the Nm through selective sire criteria, excluding male cattle with poor body conformation, coat color, and horn structure. Additionally, phasing out dams with undesirable traits, such as low udder quality or poor reproductive performance, will further optimize herd composition. Mezgebe et al. (2017) noted that small and large farms primarily off-take young stock, demonstrating the potential for strategic cattle management aligned with environmental and economic objectives. To enhance sustainability in Ethiopia’s dairy sector, focusing on exotic or crossbred cows rather than indigenous breeds is crucial to reduce GHG emissions. Expanding AI programs with locally produced frozen semen from exotic breeds, while monitoring inbreeding rates, can achieve long-term efficiency and environmental benefits.
6. Impacts of scenarios on GHG emission
Various studies on GHG mitigation have shown limited feasibility for strategies like advanced feeding practices and manure management, as they often fail to yield significant productivity improvements. Substituting large ruminant meat with pork has also been deemed impractical due to cultural and religious considerations. Cattle accounted for 129.2 out of the total 142.6 megatons of CO2-equivalent GHG emissions during the year of 2017/18 in Ethiopia, with enteric CH4 emissions contributing 10,378 kilotons/year from grassland systems and 42,341 kilotons/year from mixed farming systems. The emission intensities (EI) for these systems were 12.3 and 12.1 kg CO2-eq./1 L milk, respectively (Menghistu et al., 2021).
(1) GHG mitigation by improving of cattle breeds
Under SCN 1, enteric CH4 emissions from indigenous cattle decreased from 247.84 tons to 60.73 tons/year (a 75.50% reduction), while SCN 2 achieved an even greater reduction to 22.76 tons/year (90.82%). These reductions reflect a significant decline in the indigenous cattle population, from 13,824 head at baseline to 11,402 head in SCN 1 and 1,583 head in SCN 2. Concurrently, the number of crossbred and exotic cattle increased substantially to 8,474 head and 973 head, respectively, in SCN 1, further contributing to lower emissions intensity.
(2)GHG mitigation by off-take of indigenous breeding cattles
In Table 6. GHG emissions from milking cows rose under SCN 1, from 13,587 tons/year at baseline to 34,176 tons/year, due to an increase in milk production capacity. However, SCN 2 reduced these emissions by 21.12%, to 16,456 tons/year, reflecting a shift to a more efficient herd composition.
Table 6.
Mitigation of GHG emissions by genetic improvement and off-take of indigenous cattle in the target area.
| Category | Baseline | SCN 1 | SCN 2 | ||||||
| GHG* | Enteic CH4* | GHG | Enteric CH4 | % Reduction | GHG | Enteric CH4 | % Reduction | ||
| Farms | Overall | 326,509 | 292,164 | 313,053 | 273,860 | -4.12 | |||
| Registered | 20,254 | 18,124 | 38,412 | 28.108 | 89.65 | ||||
| Others | 306,255 | 27,040 | 274,641 | 45,752 | -10.32 | ||||
| Cattle Breeds** | Overall | 247.84 | 60.73 | -75.50 | 22.76 | -90.82 | |||
| Indigenous breeds | 231.25 | 35.62 | -84.60 | 17.30 | -92.52 | ||||
| Cross breeds | 15.57 | 23.42 | 50.42 | 4.61 | -70.39 | ||||
| Exotic breeds | 1.03 | 1.69 | 64.08 | 0.85 | -17.48 | ||||
| Breeding Cattle*** | Overall | 18,819 | 39,478 | 109.78 | 19,007 | 1.01 | |||
|
Milking cows (Dams) | 13,587 | 34,176 | 151.53 | 16,456 | 21.12 | ||||
| Breeding males | 3,375 | 292 | -91.35 | 141 | -95.82 | ||||
| Heifer | 917 | 2,926 | 219.08 | 1,409 | 53.65 | ||||
| Calf | 941 | 2,085 | 121.57 | 1,002 | 6.48 | ||||
|
Cattle per farm | Overall | 24.10 | 29.77 | 23.55 | 14.35 | -40.44 | |||
|
Milking cows (Dams) | 11.25 | 20.61 | 83.24 | 7.92 | -29.61 | ||||
| Breeding males | 6.28 | 0.89 | -85.79 | 0.69 | -88.95 | ||||
| Heifer | 5.16 | 5.16 | 59.21 | 3.35 | 3.47 | ||||
| Calf | 3.10 | 3.10 | -6.66 | 2.38 | -28.30 | ||||
Notes: *The unit of GHG and Enteric CH4 is tons of CO2-eq./year; **Data source of cattle breed: Oromia Regional State of Agriculture (KOICA, 2023); ***Estimated number are based on the average % of cattle growth stage (Berhe et al., 2019. Capper et al., 2020).
The male cattle, primarily used for breeding and draught power, experienced a dramatic reduction in GHG emissions from 3,375 tons/year at baseline to 292 tons/year in SCN 1 and 141 tons/year in SCN 2 (a 95.82% reduction). This transition marked a move away from traditional multi-purpose cattle to specialized dairy production.
GHG emissions from heifers and calves exhibited variable trends. While SCN 1 increased emissions to 2,926 tons/year for heifers and 2,085 tons/year for calves, reflecting the introduction of crossbred calves, SCN 2 decreased these emissions to 1,409 tons/year and 1,002 tons/year, respectively, as young stock transitioned into productive milking operations. This gradual transition underscores the importance of phasing in high-yielding cattle for long-term efficiency gains.
7. Dairy farming for sustainability
The adoption of high-performance breeds, such as KHF, offers substantial economic and environmental benefits. Improved breeds produce approximately 15 times more milk with fewer animals. This reduction in cattle numbers lowers emissions intensity (EI), as higher-yielding breeds emit less CH4 per liter of milk (Bayssa et al., 2021).
However, the adaptation of Holstein breeds to Ethiopia’s environment presents challenges. These breeds require significant feed and water resources, which may be scarce under local climatic and agricultural conditions. Effective environmental management, including advanced feeding and water practices, is essential to optimize productivity and sustainability.
(1) Genetic improvement and GHG reduction
This study highlights the potential of genetic improvement and optimized breed composition in reducing GHG emissions while increasing milk productivity. Phasing out low-performing indigenous cattle and adopting high-yield crossbred or exotic cattle, as seen in SCN 2, reduces emissions and improves productivity. For example, the systematic replacement of indigenous cattle led to a 90.82% reduction in enteric CH4 emissions, demonstrating the viability of targeted breed adjustments.
International cooperation, including foreign development assistance, knowledge-sharing initiatives, and investment in local frozen semen production, will be crucial to overcoming adaptation challenges. Additionally, raising awareness among farmers about climate change and sustainable livestock practices is key. Currently, only 24.14% of peri-urban and 19.61% of urban farmers are aware of climate change risks, despite clear evidence of its impact on feed and water availability (Hailemiriam, 2018; Abazinab, 2022). Addressing this gap through education and training can further support Ethiopia’s transition to low-carbon dairy farming.
(2) Technological and management advances
Recent advancements in feeding strategies and crop systems have reduced CH4 emissions. For instance, mixed feeding systems, while efficient, may increase CH4 emissions compared to forage-based diets, highlighting the need for improved feed practices (Tegegne et al., 2013). Technological innovations, such as concentrated feed, rotational grazing, and manure management, have demonstrated dramatic reductions in EI. Capper et al. (2020) reported an 80.8% reduction in EI in the U.S. dairy sector over a decade due to better feed efficiency and herd management. Applying similar strategies in Ethiopia can yield comparable benefits.
By integrating herd structure, genetic management, and sustainable practices, Ethiopia can align its dairy sector with global GHG reduction targets. Improvements in livestock productivity, combined with better management and technology adoption, are essential to mitigating the rapid rise in GHG emissions, as suggested by Minx et al. (2022).
Conclusion
In Scenario 1, the introduction of exotic breeds with high CH4 EF per head, and in Scenario 2, the reduction of the proportion of indigenous cattle, have revealed the potential to reduce enteric CH4 emissions by 75.50%. Furthermore, applying Ne values to off-take resulted in an even greater reduction rate, reaching 90.82%. Meanwhile, examining the growth stages of dairy cattle shows that in the early stages of the project, the increase in exotic calves and heifers led to an overall increase of 109.78%. However, this growth was limited to just a 1.01% increase due to the reduction in breeding indigenous bulls. Therefore, it is essential to maintain an appropriate balance between the two scenarios as well as breeding strategies aimed at herd improvement across growth stages. This scenario demonstrated the advantages of optimizing herd composition to improve productivity and reduce emissions, showcasing its alignment with Ethiopia’s GHG reduction targets. The research also emphasized the importance of maintaining an optimal Ne and managing Δf. Farms employing AI observed an increase in Ne but also experienced higher Δf risks. To overcome these challenges requires selective breeding practices, phasing out underperforming dams, and enhancing the adoption of exotic and crossbred cows. Furthermore, the supply of frozen semen from exotic cattle should carefully monitor inbreeding rates to maintain herd quality over the long term.
In conclusion, this study provides a robust framework for integrating genetic improvement programs and sustainable practices to advance Ethiopia’s dairy sector. Both scenarios—genetic improvement and breed composition optimization through off-taking of indigenous cattles—demonstrated significant reductions in total GHG emissions, with SCN 2 offering the greatest environmental benefits. However, successful implementation requires tailored solutions, including adequate feed resources, efficient management practices, and adaptation strategies for high-performance breeds. Future efforts should prioritize expanding genetic improvement programs, improving farmer education, and fostering international cooperation to achieve sustainable dairy farming and climate resilience.
