

Introduction
Materials and Methods
1. Experimental Materials
2. Concentration Process
3. Sample Analysis
Results and Discussion
1. Changes in pH and Electrical Conductivity (EC) under Concentration Conditions
2. Changes in Nutrient (N, P, K) Concentrations under Concentration Conditions
3. Changes in Germination Index (GI) under Concentration and Dilution Conditions
Conclusion
Introduction
The expansion of the livestock industry has made the proper management of livestock manure a critical task for environmental protection and the advancement of sustainable agriculture (Jeong et al., 2020). Liquid fertilizer produced from swine farms is particularly rich in essential nutrients such as nitrogen (N), phosphorus (P), and potassium (K), making it a highly valuable fertilizer source. However, its high moisture content poses challenges in storage, transportation, and application, leading to increased logistics costs and reduced application efficiency (Im et al., 2021). To overcome these issues, vacuum evaporation concentration technology has recently gained attention as an effective solution. This process removes moisture under vacuum at low temperatures, thereby reducing the volume of liquid fertilizer, improving storage and transportation efficiency, and minimizing nutrient loss. During concentration, the liquid fertilizer is separated into a nutrient-rich concentrate suitable for fertilizer use and a condensate with relatively low pollutant concentrations, contributing to environmental protection (Choi, 2021). However, highly concentrated liquid fertilizer can lead to excessive salt accumulation, which may negatively affect crop growth by inducing biological toxicity, particularly during seed germination and early growth stages (Im et al., 2021). In line with greenhouse gas reduction and carbon neutrality initiatives, various manure treatment technologies — including the production of biochar, bioplastics, and solid fuels — are increasingly promoted through national policies (MAFRA, 2021). Accordingly, this study aims to apply a vacuum evaporation concentration process to filtered liquid fertilizer derived from swine manure, analyze changes in nutrient (N, P, K) concentrations and recovery rates, and evaluate the germination index (GI) of both concentrate and diluted solutions to assess biological safety. Through this approach, the study seeks to propose agricultural utilization strategies and appropriate management methods for concentrated filtered liquid fertilizer.
Materials and Methods
1. Experimental Materials
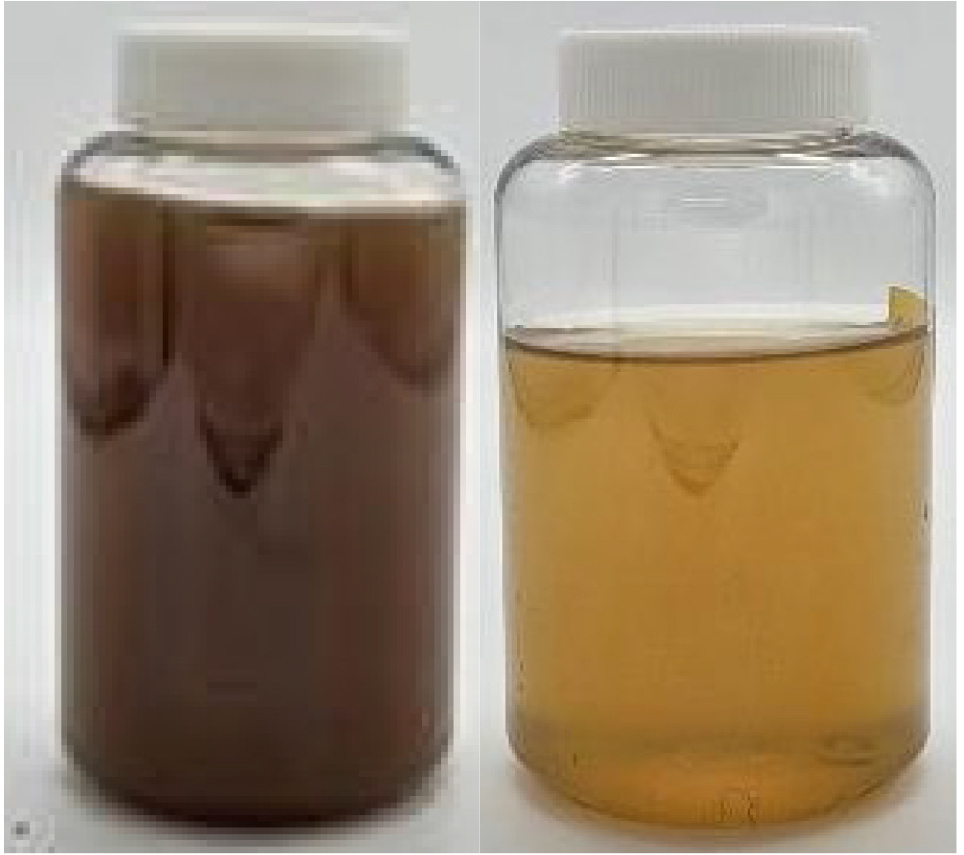
Filtered liquid fertilizer was used as the experimental material in this study. The fertilizer was collected in August 2024 from a swine farm located in Hoengseong- gun, Gangwon Special Self-Governing Province. Prior to use, the raw liquid fertilizer underwent a pretreatment process involving electrocoagulation to remove suspended solids and reduce the organic load, thereby enhancing filtration efficiency and ensuring greater stability during the concentration process. Following electrocoagulation, the treated fertilizer was filtered to obtain the final filtered liquid fertilizer used in the experiments. Figure 1 presents a comparative image of the liquid fertilizer before and after electrocoagulation, illustrating the removal of suspended matter and the improvement in clarity (Figure 1).
2. Concentration Process
The concentration of the filtered liquid fertilizer was performed using a rotary vacuum evaporator (N-1000, EYELA, Tokyo Rikakikai Co., Ltd., Japan) equipped with a vacuum pump (LABOPORT, KNF Neuberger GmbH, Germany). A volume of 840 mL of the filtered liquid fertilizer was placed into a round-bottom flask and concentrated to target volumes of 420 mL (2×), 280 mL (3×), and 210 mL (4×). The concentration process was conducted at a water bath temperature of 50 ± 3 °C, a vacuum pressure of 8 mbar, and a suction rate of 20 L/min.
3. Sample Analysis
The pH and electrical conductivity (EC) of the samples were measured in accordance with the Standard Methods for Water Pollution Process Test. Measurements were conducted using a YSI Multilab IDS 4010-2 meter (Xylem Inc., Washington, DC, USA). The concentrations of nitrogen (N), phosphorus (P), potassium (K), and the germination index (GI) were analyzed based on the Methods for Fertilizer Quality Inspection and Sampling Standards. Nitrogen was determined using the sulfuric acid digestion method, phosphorus by the colorimetric method, potassium by the tetraphenylborate method, and GI through the seed germination method. Phosphorus and potassium results were converted and reported as P2O5 and K2O concentrations, respectively.
Results and Discussion
1. Changes in pH and Electrical Conductivity (EC) under Concentration Conditions
After concentrating the filtered liquid fertilizer through vacuum evaporation, pH and electrical conductivity (EC) were analyzed, revealing distinct changes depending on the concentration ratio (Figure 2).
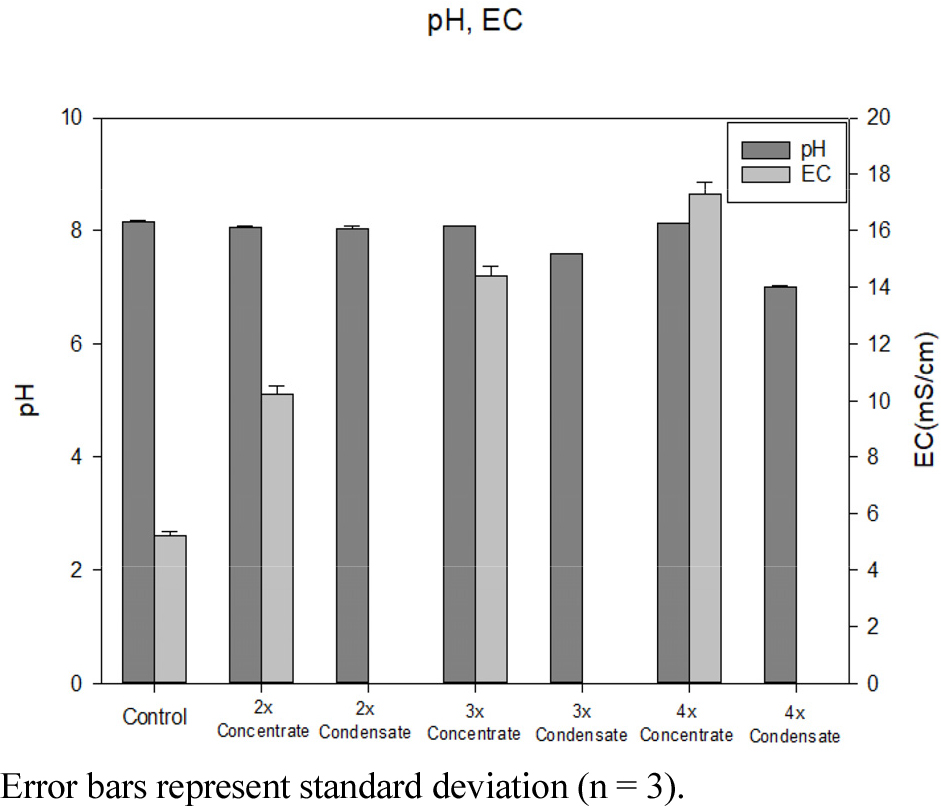
The pH of the original liquid fertilizer was 8.15, while the pH values for the 2×, 3×, and 4× concentrates were 8.06, 8.07, and 8.12, respectively, showing slight decreases or maintenance with increasing concentration. In contrast, the pH values of the condensate were 8.04, 7.58, and 7.00 for the 2×, 3×, and 4× conditions, respectively, indicating a clear decreasing trend with higher concentration ratios. These results suggest that some nitrogen compounds, particularly ammonium nitrogen (NH4+-N), which are prone to volatilization under lower pH conditions, may have been lost during the concentration process (Jeon et al., 2013).
The EC of the original liquid fertilizer was 5.21 mS/cm, and the EC values of the 2×, 3×, and 4× concentrates increased to 10.22, 14.40, and 17.29 mS/cm, respectively. This increase is attributed to the concentration of dissolved ions resulting from water removal during evaporation. Meanwhile, the EC of the condensate remained very low, at 0.005 mS/cm under all concentration conditions, indicating that most dissolved ions were effectively retained in the concentrate. These findings demonstrate the efficiency of the vacuum evaporation process in concentrating nutrients while minimizing ion loss.
2. Changes in Nutrient (N, P, K) Concentrations under Concentration Conditions
The concentrations of nitrogen (N), phosphorus (P), and potassium (K) in the filtered liquid fertilizer increased with higher concentration ratios.
The nitrogen concentration rose from 484.64 mg/L in the original liquid fertilizer to 739.87 mg/L, 987.92 mg/L, and 1171.33 mg/L in the 2×, 3×, and 4× concentrates, respectively. However, the total nitrogen recovery rates decreased with increasing concentration, recording 76.33% at 2×, 67.95% at 3×, and 60.42% at 4× (Table 1), indicating nitrogen loss likely due to volatilization under high-concentration conditions.
Table 1.
Changes in concentration, total amount, and recovery rate of nitrogen (N) in concentrate and condensate.
The phosphorus concentration increased from 33.29 mg/L in the original liquid fertilizer to 60.41 mg/L, 87.98 mg/L, and 119.37 mg/L in the 2×, 3×, and 4× concentrates, respectively. Phosphorus recovery rates remained stable above 88% across all conditions (Table 2), suggesting that phosphorus, being non-volatile, was effectively retained during the concentration process.
Table 2.
Changes in concentration, total amount, and recovery rate of phosphorus (P) in concentrate and condensate.
Similarly, the potassium concentration increased from 1,550 mg/L in the original liquid fertilizer to 3,090.4 mg/L, 4,631.05 mg/L, and 6,162 mg/L at the 2×, 3×, and 4× concentration levels, respectively. The potassium recovery rate remained exceptionally high, exceeding 99% under all concentration conditions (Table 3), indicating minimal loss due to the non-volatile nature of potassium ions during the evaporation process.
Table 3.
Changes in concentration, total amount, and recovery rate of potassium (K) in concentrate and condensate.
3. Changes in Germination Index (GI) under Concentration and Dilution Conditions
The germination index (GI) was evaluated for each concentrate and its diluted solutions, revealing a decreasing trend in GI with increasing concentration ratio (Figure 3, Figure 4).

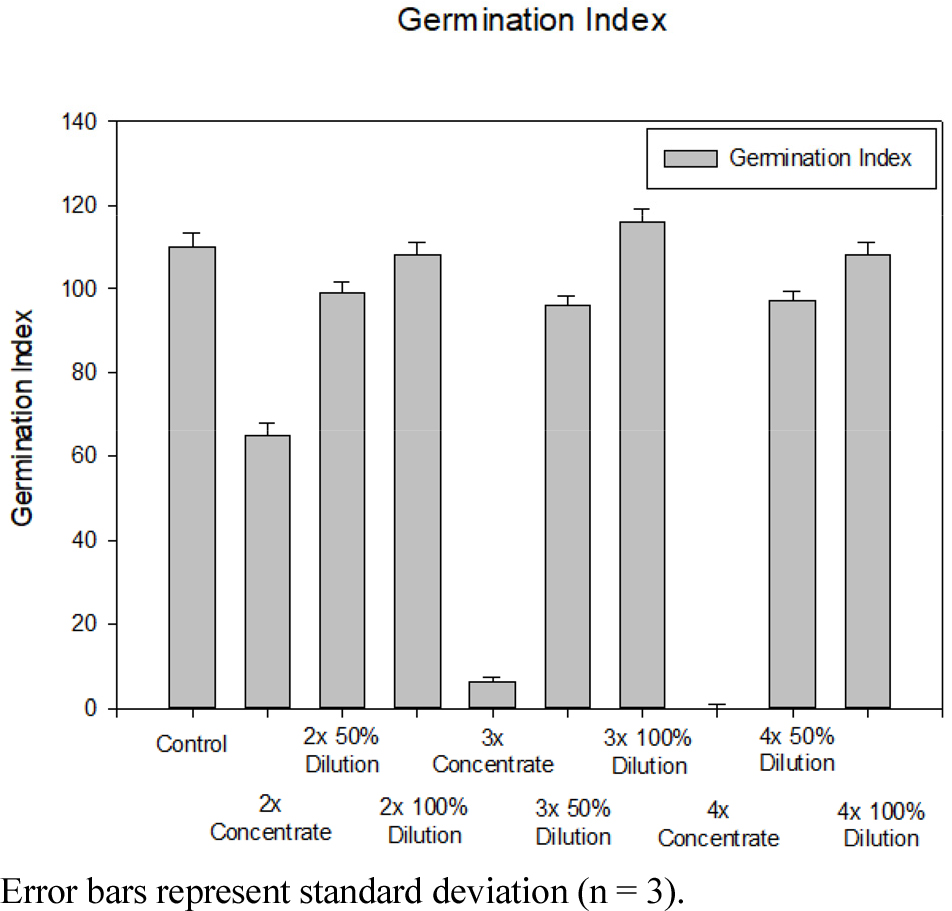
In the 2× concentrate, the GI remained above the critical threshold of 70, and both 50% and 100% dilution treatments further improved GI values, confirming no inhibitory effects on seed germination and root growth.
In the 3× concentrate, the GI dropped below 70, indicating the presence of phytotoxicity; however, 50% and 100% dilution treatments restored GI values above 70, suggesting that biological safety was effectively recovered through dilution.
In the 4× concentrate, severe inhibition of seed germination and root growth was observed, with GI values falling well below the critical threshold due to the accumulation of nutrients and salts at high concentrations.
Based on these results, it can be concluded that when filtered liquid fertilizer is concentrated beyond 3×, at least 50% dilution is necessary to ensure biological safety prior to agricultural application. This finding aligns with previous research demonstrating that appropriate dilution of concentrated livestock liquid fertilizers significantly improves seed germination and reduces phytotoxicity (Byeon et al., 2021).
Conclusion
With growing attention on improving the management efficiency of liquid fertilizer in nutrient-surplus regions, this study evaluated changes in fertilizer component concentrations and biological safety by applying a vacuum evaporation concentration process to filtered liquid fertilizer derived from swine farms. The primary objective was to facilitate the wide-area distribution of liquid fertilizer by reducing its volume through concentration, with the ultimate goal of applying it to farmland after dilution to levels suitable for crop cultivation. This approach not only enhances logistical efficiency but also contributes to reducing environmental burdens and establishing a sustainable agricultural system.
The concentrations of nitrogen (N), phosphorus (P), and potassium (K) in the concentrate significantly increased with higher concentration ratios. Phosphorus and potassium exhibited stable recovery rates, whereas nitrogen showed a decreasing recovery trend, with part of the nitrogen detected in the condensate. This finding highlights the need for careful management to minimize nitrogen loss under high-concentration conditions.
Analysis of the germination index (GI) across concentration and dilution conditions revealed that GI decreased with increasing concentration but was restored to above 70% following 50% and 100% dilution treatments. These results indicate that appropriate dilution after concentration is essential to ensure the safe agricultural application of concentrated filtered liquid fertilizer.
The findings of this study support the potential use of concentrated filtered liquid fertilizer as an effective fertilizer source and provide fundamental data for optimizing the concentration process to minimize nitrogen loss and enhance biological safety. However, a limitation of this study is the lack of detailed analysis of other factors, such as copper (Cu), zinc (Zn), manganese (Mn), and salinity, which could also influence seed germination and root growth. Therefore, future studies should investigate the concentration behavior of heavy metals and trace elements during the concentration process and assess whether the final concentrate meets fertilizer quality standards.
