

Introduction
Materials & Methods
1. Experimental design
2. Sampling and analytical method
3. Statistical analysis
Results & Discussion
1. Physicochemical Changes During Composting
2. NH3 Concentration and Emission Dynamics
3. N2O Concentration and Emission Dynamics
Conclusion
Introduction
Agricultural residues are increasingly recognized as leverage points for achieving air-quality and climate targets. Livestock production alone contributes more than 80 % of global atmospheric ammonia (NH3) and a significant share of nitrous oxide (N2O) emissions-two reactive nitrogen species that have increased steadily since the 1990s (ME 2025). NH3 is a strong respiratory irritant and a major precursor of secondary PM2.5, while N2O carries a 100-year global-warming potential 273 times that of CO2 and also depletes stratospheric ozone (Nabuurs et al., 2022; Wyer et al., 2022). Mitigating both gases at their source is therefore a priority for environmental engineers.
Composting is the principal treatment for cattle manure because it reduces moisture, destroys pathogens and produces a stabilized fertilizer. Composting is the principal treatment for cattle manure in the Republic of Korea. As of 2023, approximately 90% of Hanwoo (Korean native beef) farms collect manure using bedding materials, and over 90% of all Hanwoo farms compost the collected manure (KOSTAT 2025). The significance of this practice is amplified by the trend towards farm consolidation, which increases manure generation per farm, and by strong government initiatives targeting greenhouse gas (GHG) emission reductions from the livestock sector (aiming for an 18% cut by 2030) (MAFRA 2024). Indeed, cattle manure management is a major emission source, accounting for nearly half of the total GHG emissions from livestock manure treatment processes. However, the commonly employed low-aeration composting of this bedded manure can lead to significant NH3 volatilization (losing up to one-quarter of initial nitrogen) and appreciable N2O emissions, representing both environmental harm and fertilizer-value leakage.
Rice husk is an abundant agricultural residue; specific estimates suggest around 150 million tonnes are generated annually worldwide (Kordi et al., 2024). More than 90% of rice husk is disposed of through environmentally harmful practices, such as open burning, or discarded into rivers or seas (Quispe et al., 2017). Uncontrolled burning of rice residue causes fire hazards and releases a range of air pollutants, notably including carbon dioxide (CO2), carbon monoxide (CO), methane (CH4), sulfur dioxide (SO2), nitrogen oxides (NOX), and particulate matter (PM2.5 and PM10) (Junpen et al., 2018; Singh, 2018). This practice significantly contributes to air pollution, negatively impacting both the environment and human health (Golshan et al., 2002). Converting it to biochar through pyrolysis offers a sustainable alternative, sequestering carbon and yielding a porous, alkaline material with high cation-exchange capacity (Nanda et al., 2016). These properties give rice husk biochar (RHB) a strong affinity for ammonium and the potential to alter nitrification- denitrification pathways, making it an attractive amendment for nitrogen conservation during composting (Asadi et al., 2021; Kang et al., 2024).
A growing body of research confirms the potential of RHB to mitigate NH3 emissions and enhance nitrogen retention during manure composting. Alarefee et al. (2023) demonstrated that the incorporation of RHB into poultry litter compost mixtures significantly reduced cumulative NH3 emissions by 78% to over 97%, depending on the initial C/N ratio. These reductions were accompanied by enhanced total nitrogen retention in the final compost, highlighting the role of RHB in stabilizing nitrogen during composting. Another study specifically found that adding 15% RHB reduced NH3 emissions by 86-97% during poultry manure composting (Zhang et al., 2021). Omar et al. (2021) showed that rice husk compost, characterized by a high cation exchange capacity, effectively minimized NH3 volatilization from urea through the retention of NH4+, thereby supporting its role as a nitrogen-stabilizing amendment. Furthermore, a large meta-analysis of manure composting (371 observations) reported that biochar addition contributed synergistically to overall greenhouse gas reduction, with particularly prominent reductions observed for N2O (44%) and CH4 (43.6%) (Liu et al., 2023). While the overall efficacy of biochar is well documented, relatively few investigations have quantified both NH3 and N2O emissions from Hanwoo bedded manure, which are the predominant composting practice in Republic of Korea.
Therefore, Hanwoo bedded manure was composted for 58 days using intermittently turned piles at a pilot scale. The primary aim of this study was to assess the efficacy of rice husk biochar in mitigating the NH3 and N2O emissions generated during this composting process.
Materials & Methods
1. Experimental design
The pilot-scale composting experiment was conducted over 58 days using 800 L capacity six compost piles and established two treatments in triplicate. Each 800 L pile was contained within a dual-structured enclosure designed to maintain geometric consistency across replicates and facilitate internal oxygen diffusion. The inner layer, composed of 4-mesh stainless steel wire (1 mm thickness), served to retain finer compost particles and prevent material loss, while the outer frame, constructed from wire mesh with 150 mm × 150 mm spacing, provided structural support to maintain the overall pile shape throughout the composting period.
The Control group (CON) consisted solely of Hanwoo bedded manure, with approximately 478 kg composted per bin without any amendments. For the Treatment (RHB), the Hanwoo bedded manure was amended with rice husk biochar, which had been produced by pyrolyzing rice husks at 550°C. This biochar was added at a rate of 10% based on the initial dry weight of the bedded manure and thoroughly mixed at the start of the experiment. The initial moisture and volatile solids contents of the starting materials for both treatments are presented in Table 1. Throughout the 58-day composting period, the piles in both the CON and RHB treatments were managed using an intermittent turning strategy, with manual turning conducted on day 13 and day 42 to facilitate aeration and homogenization.
Table 1.
Initial moisture and volatile solids contents of control and treatment groups. (Mean ± S.D., n=3)
| Parameter | CON | RHB |
|
Moisture content (%, wet basis) | 65.9 ± 0.2 | 67.6 ± 0.7 |
|
Volatile solid content (%, dry basis) | 79.6 ± 0.2 | 78.7 ± 0.3 |
2. Sampling and analytical method
Gaseous emissions (NH3 and N2O) from each compost pile were quantified using custom-designed enclosed-flux chambers (volume: 2.2 m3). To ensure internal air homogenization within the chamber during measurement periods, each chamber was equipped with four mixing fans (100 mm diameter). An exhaust fan (100 mm diameter) facilitated controlled ventilation, allowing for the measurement of exhaust gas concentrations and ventilation rate. To determine ventilation rate, multipoint velocity measurements were performed across the duct cross- section using a hot wire-anemometer (TES-1341, TES Electrical Electronic Corp., Taiwan). The duct cross-section was divided into a 3 × 3 grid, and average velocity was used to calculate ventilation rate. The recovery rate of the flux chamber system, validated using a NH3 standard gas, yielded an average recovery of approximately 104.8%.
To determine the exhaust gas concentrations, samples were drawn from the midpoint of the exhaust duct connected to the fan using an integrating pump (MP-∑500KNII, Sibata Scientific Technology Ltd, Japan). To investigate the internal gaseous concentrations within the compost piles and compare differences resulting from biochar addition, gas samples were collected from three distinct locations (center, middle, and outer) at the mid-height of each pile. Center, middle, and outer locations are denoted as (C), (M), and (O), respectively, indicating the corresponding positions within each pile. Accordingly, labels such as CON (C), CON (M), and CON (O) refer to the control group at each respective location, while RHB (C), RHB (M), and RHB (O) indicate the same for the biochar-amended group. These internal gas samples were collected using a portable sampling pump (PCXR8, SKC Inc, USA). The collected gas samples were then analyzed to determine NH3 and N2O concentrations. NH3 concentrations were measured using a gas detector based on tunable diode laser spectrometry (LGD Compact-A NH3/H2O, Axetris AG, Switzerland). N2O concentrations were measured using a photoacoustic spectroscopy analyzer equipped with a quantum cascade laser (LSE N2O-4405, LSE Monitors, The Netherlands).
Temperature within each pile at the same mid-height locations (center, middle, and outer), along with ambient temperature, were monitored every minute using a NI-9214 module (National Instruments, USA). In-pile oxygen concentration was measured using an oxygen analyzer (Pick-O2, Hae Song Industry Co. Republic of Korea) .
Emission rates for NH3 and N2O, based on measured exhaust gas concentrations, chamber ventilation rate, and gas temperature, were calculated as follows:
Where:
Cgas: Concentration of each gaseous compound (mL m-3)
VR: Daily ventilation volume (m3 day-1)
Tempgas: Gas temperature (℃)
MW: Molecular weight of each compound (g mol-1)
TS: Amount of total solid of compost pile (kg)
Moisture content (MC) was determined by oven-drying the samples at 105℃ for 24 hours, followed by analysis of volatile solids (VS) through combustion at 550℃ for 8 hours. Wet bulk density was calculated by dividing the mass of each sample by its volume, measured using 1 L stainless steel containers. Total nitrogen (TN) content was measured using an elemental analyzer (FlashSmart, Thermo Fisher Scientific, USA).
3. Statistical analysis
Differences in NH3 and N2O concentrations and emissions between the control and treatment groups were evaluated using a two-tailed t-test. Statistical significance was considered at p<0.05. All statistical analyses were performed using Origin Pro software (version 8.1, OriginLab Corporation, USA).
Results & Discussion
1. Physicochemical Changes During Composting
Composting temperature plays a pivotal role in determining microbial activity, organic matter degradation, and pathogen suppression. According to De Bertoldi et al. (1983), the optimal temperature range for composting lies between 45℃ and 55℃, with thermophilic activity promoting rapid decomposition. Temperatures above 55℃ are particularly important for inactivation most pathogenic microorganisms. Both compost piles rapidly entered the thermophilic phase (Figure 1), with center temperatures exceeding 60℃ within the first three days. By day 7, the average temperatures of the CON pile at the center, middle, and outer layers were 58.2 ± 3.6℃, 56.7 ± 3.5℃, and 45.0 ± 2.0℃, respectively, while those of the RHB pile were 55.5 ± 4.9℃, 55.0 ± 5.1℃, and 45.1 ± 3.4℃. At this early stage, significantly higher temperatures were observed in the center and middle sections of the CON pile compared to the RHB pile. This trend continued through the second week, during which temperatures in the CON pile remained significantly higher at all locations: 54.3 ± 4.6℃ (center), 52.7 ± 4.5℃ (middle), and 40.3 ± 2.3℃ (outer), compared to 50.3 ± 3.9℃, 48.4 ± 3.2℃, and 38.1 ± 2.6℃, respectively, in the RHB pile.
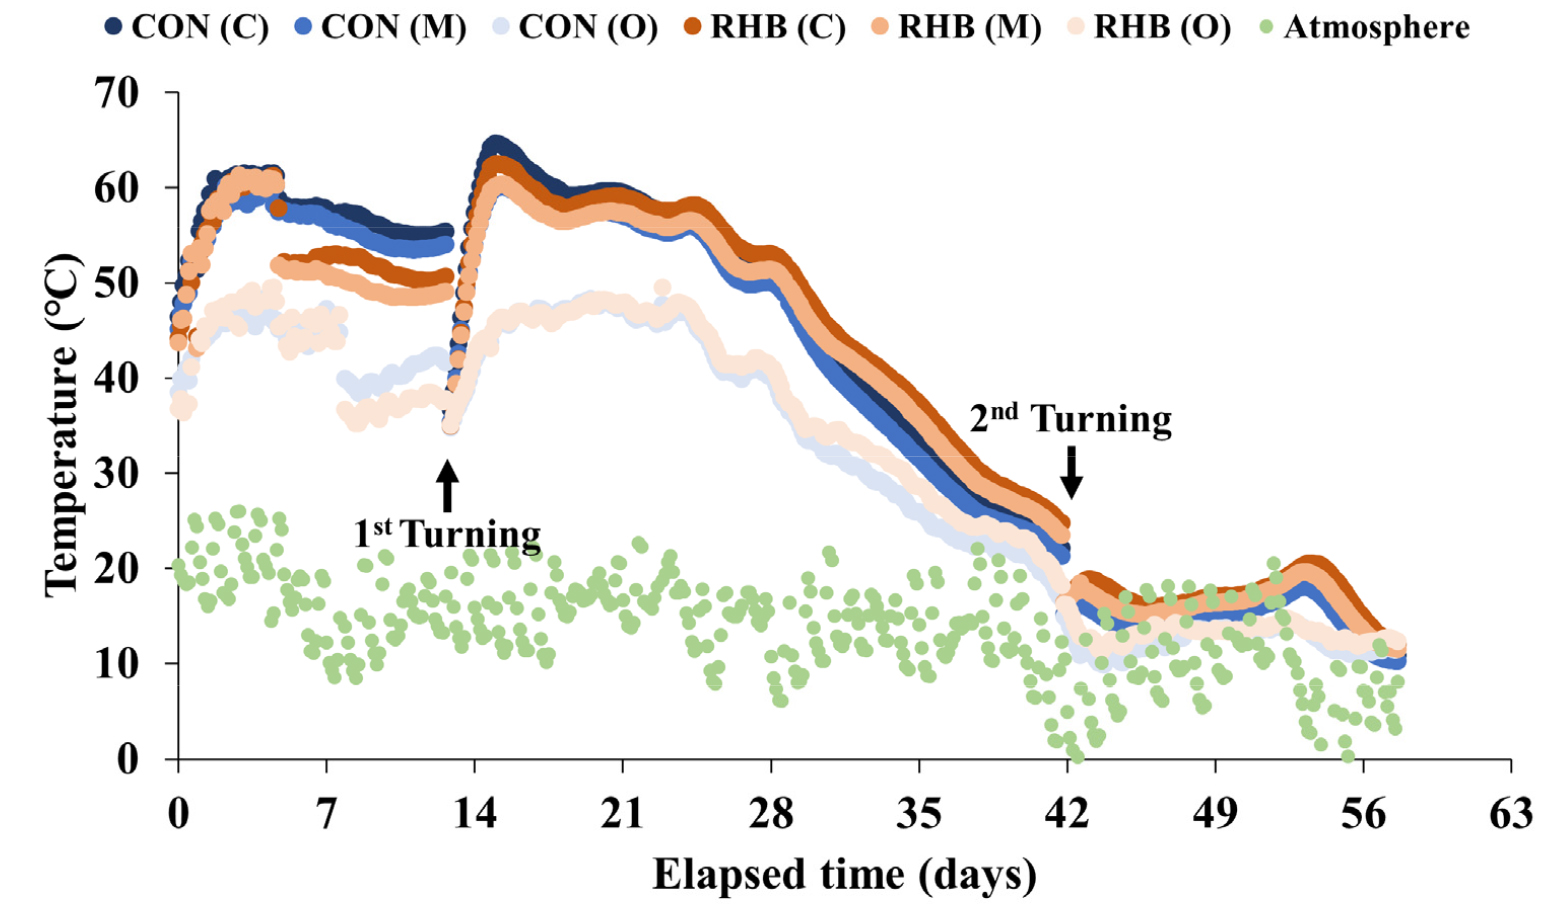
Following the first manual turning on day 14, temperatures temporarily declined but rose sharply, indicating renewed microbial activity. Peak center temperatures were recorded on day 15 at 64.6℃ in the CON and 62.5℃ in the RHB pile, with no statistically significant difference between treatments. These high temperatures are characteristic of the thermophilic phase and are essential, as this is when the maximum degradation of complex organic matter (like fats, cellulose, hemicellulose) and the crucial destruction of pathogens occur, contributing to the production of a stabilized end product (Bernal et al., 2009; Keener et al., 2000). Thereafter, temperatures gradually declined through the second turning on day 42. This decline signifies the transition towards the cooling phase, typically characterized by a decrease in temperature due to the reduction of microbial activity associated with the depletion of biodegradable organic substrates (Keener et al., 2000). Unlike the early composting phase, from day 28 onward, significantly higher temperatures were observed in all sections of the RHB pile compared to the CON. This shift likely indicates enhanced microbial activity within the biochar-amended pile, potentially facilitated by the microbial habitats provided by the biochar's porous structure (Lehmann et al., 2011; Sanchez-Monedero et al., 2018). By day 58, temperatures had stabilized across all compost layers, indicating the completion of the composting process.
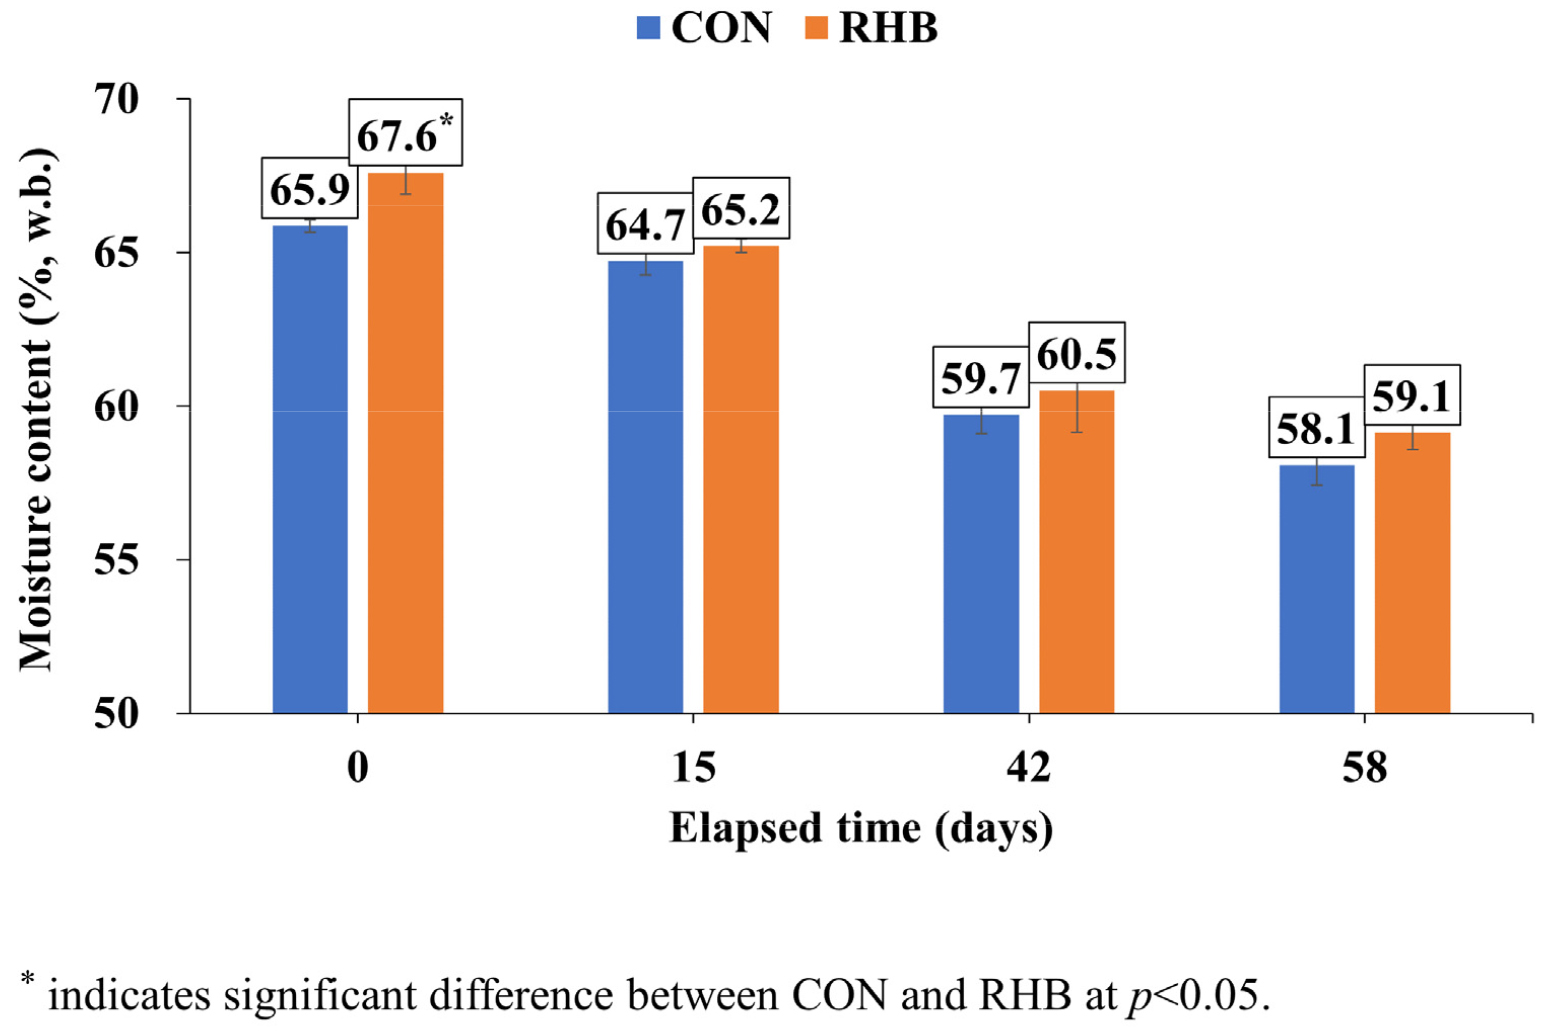
MC in both compost piles declined gradually over the 58-day composting period (Figure 2). As the composting process generates substantial heat, this leads to evaporation and thus a decrease in moisture content over time. At the beginning of the experiment, the RHB pile showed a significantly higher MC (67.6%) than the CON pile (65.9%) (p<0.05). Despite this initial difference, the moisture contents of both treatments converged over time, with no statistically significant differences observed on days 15, 42, or 58.
The RHB pile exhibited significantly enhanced organic matter degradation compared to the CON (Table 2). At the beginning of the composting process, the initial VS content was 130.0 ± 0.8 kg in the CON and 121.8 ± 2.8 kg in the RHB pile. By the end of the 58-day composting period, the amount of decomposed VS reached 33.6 ± 3.7 kg in the RHB pile and 25.1 ± 3.0 kg in the CON pile (p<0.05). This corresponds to a total decomposition rate of 27.5 ± 2.5% in the RHB treatment, significantly higher than the 19.3 ± 2.3% in the CON. Notably, during the period between the first and second turning (days 14-42), the decomposed VS in the RHB pile (13.3 ± 3.7 kg) was approximately 2.5 times higher than that in the CON pile (5.3 ± 2.8 kg) (p<0.05). This substantial difference in decomposition coincides with the temperature trends observed during the same period, where significantly higher temperatures were recorded across all layers of the RHB pile. These findings suggest that biochar amendment promoted microbial activity and organic matter degradation, particularly after the first turning, potentially due to improved aeration and microbial habitat formation within the biochar-amended compost matrix (Sanchez-Monedero et al., 2018; Steiner et al., 2011; Zhang et al., 2014).
Table 2.
Volatile solid mass balance and decomposition rate in control and biochar-amended compost piles. (Mean ± S.D., n=3)
| Parameter | Volatile solid content | ||
| CON | RHB | ||
| Initial amount (kg) | 130.0 ± 0.8 | 121.8 ± 2.8 | |
| Lost via sampling and turning (kg) | 23.5 ± 2.9 | 12.2 ± 2.6 | |
| Final remaining amount (kg) | 82.0 ± 0.9 | 76.0 ± 1.6 | |
| Decomposed amount (kg) | 0-14 day | 19.2 ± 1.3 | 19.0 ± 2.8 |
| 14-42 day | 5.3 ± 2.8 | 13.3 ± 3.7* | |
| 42-58 day | 1.7 ± 0.0 | 1.3 ± 0.9 | |
| Total decomposition rate (%) | 19.3 ± 2.3 | 27.5 ± 2.5* | |
Although biochar was included in the RHB pile, initial bulk densities showed no difference between the CON (602.8 kg m-3) and RHB (603.3 kg m-3) piles (Figure 3). As composting progressed, bulk density decreased in both treatments. By the end of the composting period (day 58), bulk density reductions were observed in both treatments. The CON pile decreased by about 10.1% to a final density of 542.2 kg m-3, while the RHB pile showed a reduction of approximately 12.2%, reaching a final density of 529.5 kg m-3. However, the difference in final bulk density between the two treatments was not statistically significant.
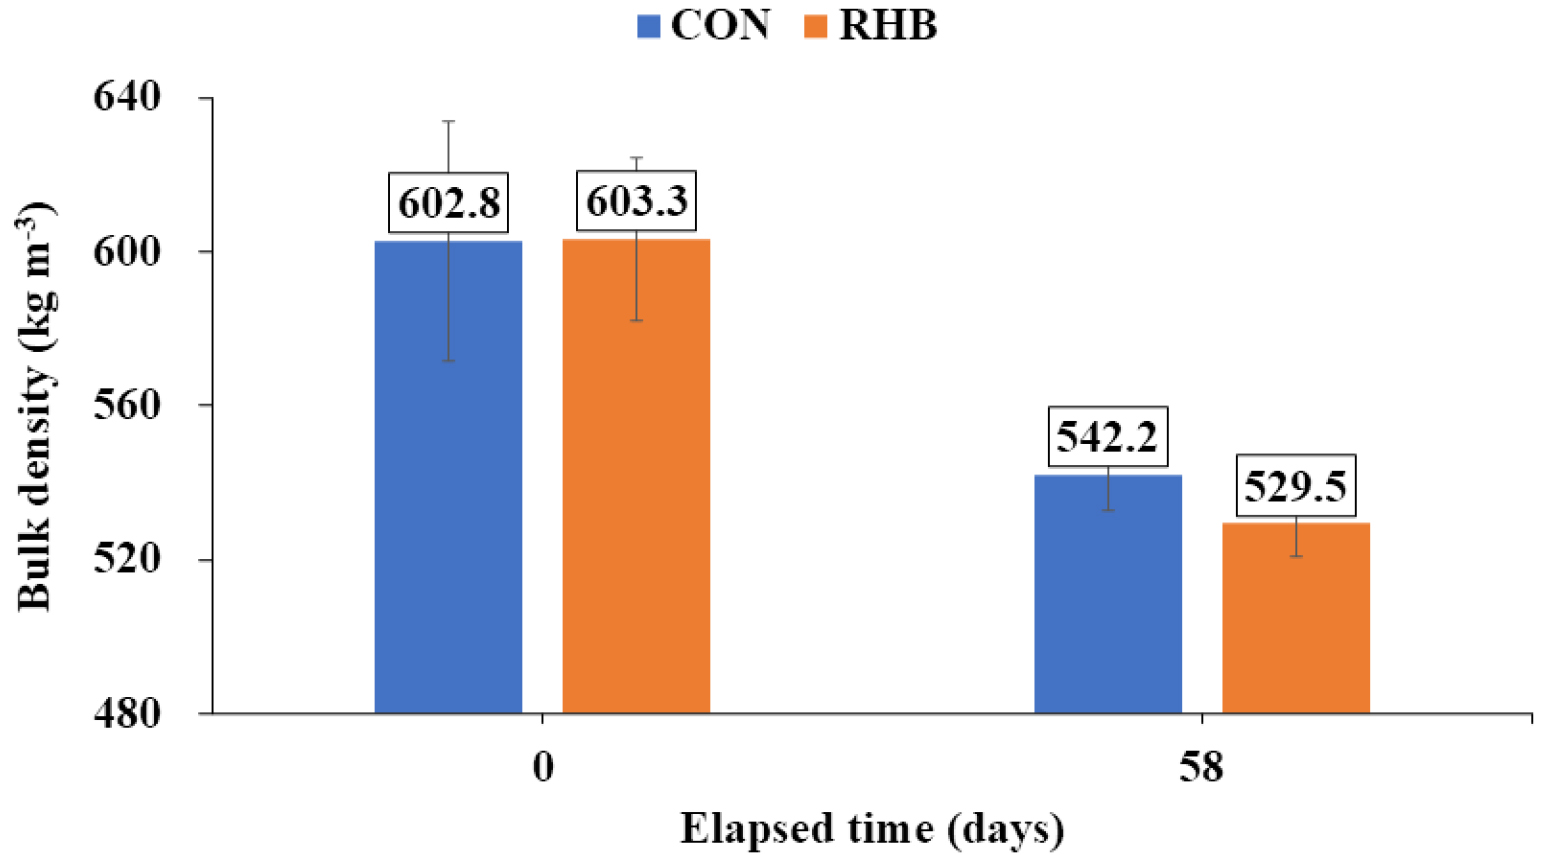
Table 3 shows the changes in oxygen concentration within both compost piles during the composting period. In the early stages (days 1-8), oxygen levels in the RHB pile were significantly lower than in the CON, particularly in the center and middle layers (p<0.05). This may reflect the rapid oxygen consumption driven by elevated microbial activity, likely enhanced by the improved porosity and aeration associated with biochar addition. However, from day 13 onward, oxygen concentrations in the RHB pile rose steadily, surpassing or matching those of the CON pile across all positions. Notably, between days 14 and 42-when the RHB pile exhibited significantly elevated organic matter degradation and higher internal temperatures-oxygen levels remained consistently high. This indicates that despite the intensified aerobic microbial activity, oxygen supply was not limited in the RHB pile. Such stability suggests that biochar amendment enhanced structural aeration, facilitating sufficient oxygen diffusion throughout the compost matrix to support active microbial processes (Sanchez-Monedero et al., 2018; Steiner et al., 2011).
Table 3.
Temporal changes in oxygen concentration at different locations within control and biochar-amended compost piles during the composting process. (Mean ± S.D., n=3)
The TN content dynamics over the composting period are summarized in Table 4. At the beginning of the experiment, the initial TN content was slightly higher in the CON pile (4.0 ± 0.0 kg) compared to the RHB pile (3.6 ± 0.0 kg). After 58 days of composting, the final remaining TN was 2.5 ± 0.0kg in the CON and 2.8 ± 0.2 kg in the RHB pile. After accounting for sampling and turning losses, the amount of nitrogen decomposed during composting was significantly lower in the RHB pile (0.6 ± 0.1 kg) than in the CON pile (0.9 ± 0.1 kg) (p<0.05). This corresponds to a nitrogen decomposition rate of 15.4 ± 1.4% in the RHB pile, which was significantly lower than the 21.8 ± 1.3% observed in the CON pile. These results suggest that biochar amendment effectively retained nitrogen within the compost pile throughout the 58-day composting period.
Table 4.
Mass balance and decomposition rate of total nitrogen in control and biochar-amended compost piles. (Mean ± S.D., n=3)
| Parameter | Total nitrogen content | |
| CON | RHB | |
| Initial amount (kg) | 4.0 ± 0.0 | 3.6 ± 0.0 |
| Lost via sampling and turning (kg) | 0.6 ± 0.0 | 0.4 ± 0.1 |
| Final remaining amount (kg) | 2.5 ± 0.0 | 2.8 ± 0.2 |
| Decomposed amount (kg) | 0.9 ± 0.1 | 0.6 ± 0.1* |
| Total decomposition rate (%) | 21.8 ± 1.3 | 15.4 ± 1.4* |
2. NH3 Concentration and Emission Dynamics
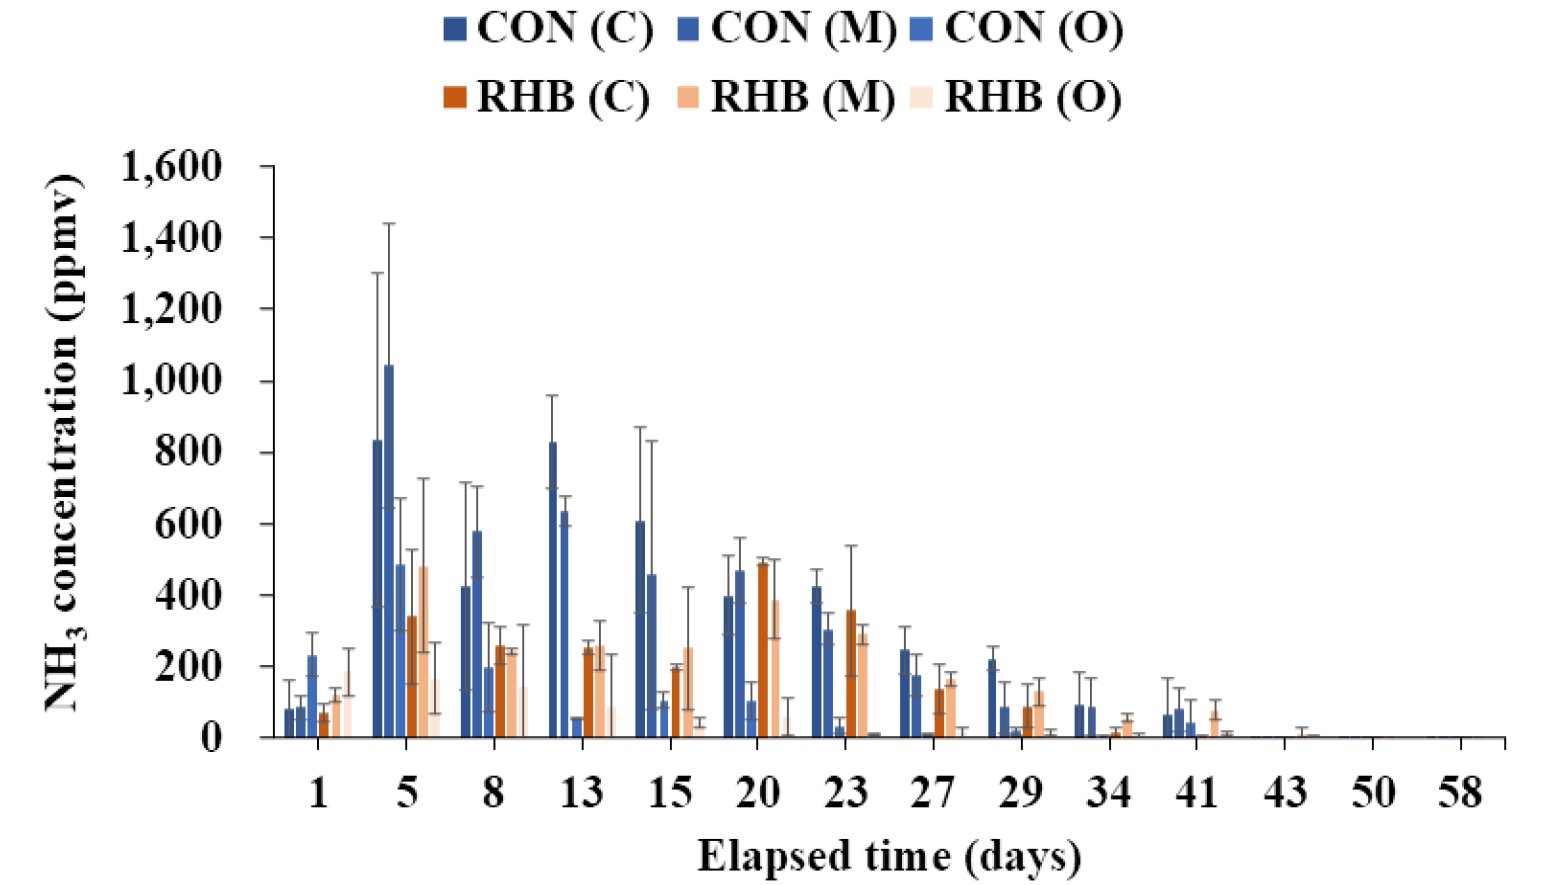
During the composting process, NH3 concentrations within the compost piles exhibited dynamic changes across the center, middle, and outer sections, with both treatments peaking during the early thermophilic phase (Figure 4). Notably, the CON pile consistently showed higher peak NH3 levels than the RHB pile across all positions. Peak concentrations reached 835.2 ppmv at the center, 1042.7 ppmv at the middle, and 484.5 ppmv at the outer section in the CON pile, compared to 339.9, 482.1, and 165.3 ppmv, respectively, in the RHB pile. These differences were statistically significant at several key time points: NH3 concentrations were significantly lower in the RHB pile on days 8 and 13 at the center, on days 8 and 10 at the middle, and on days 8 and 13 at the outer section (p<0.05). The mitigation effect of biochar is further supported by average NH3 reduction rates of 47.5%, 38.0%, and 42.3% in the center, middle, and outer layers, respectively, relative to the control.
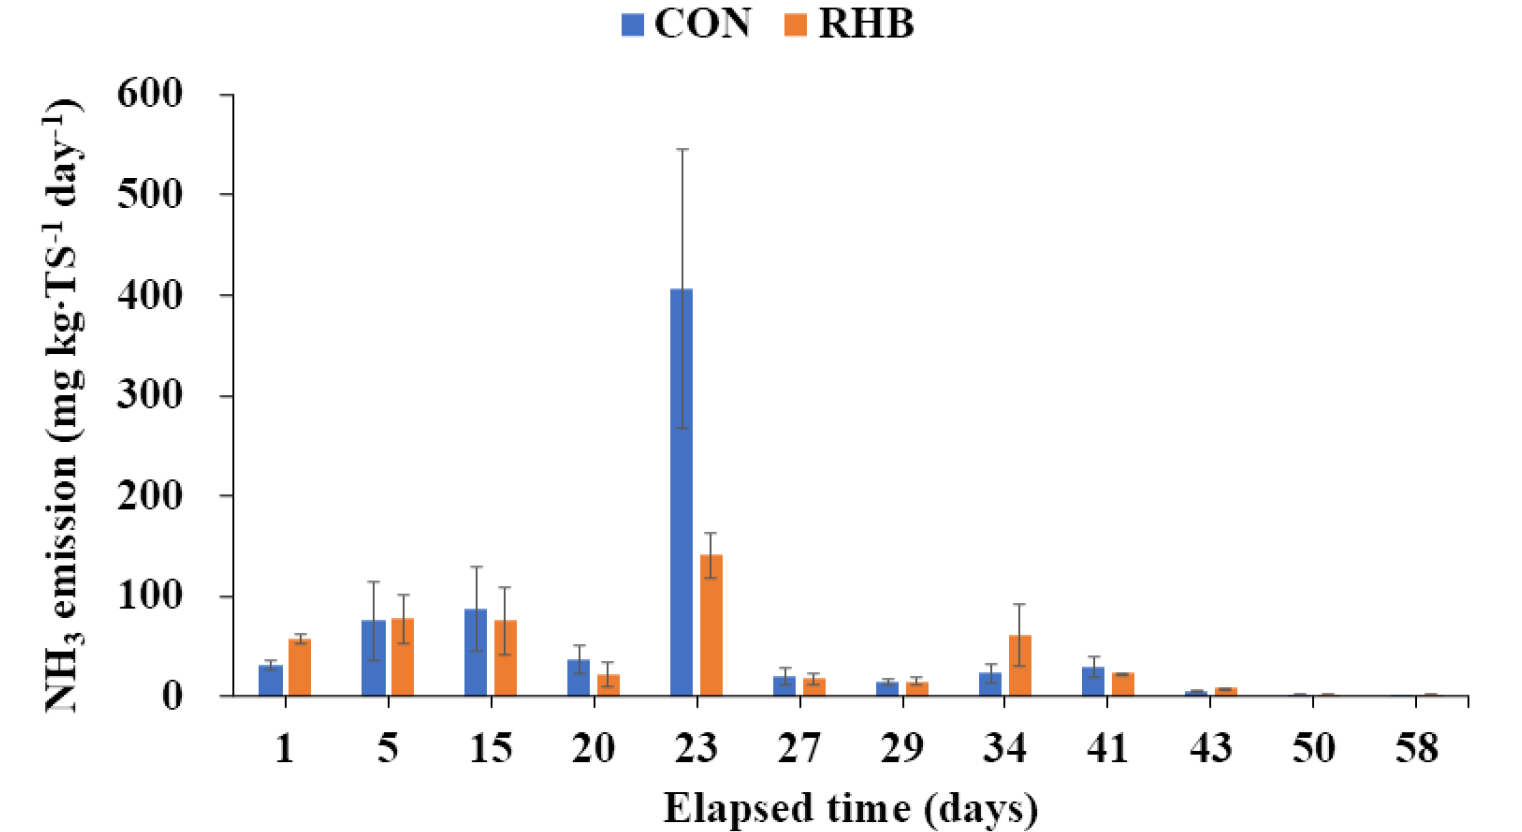
NH3 emissions from the compost piles varied notably over time, with both CON and RHB piles showing peak values during the active thermophilic phase (Figure 5). The difference in emission rates between the treatments was most pronounced on day 23, when the CON pile reached a peak of 405.8 mg kg-TS-1 day-1, significantly surpassing the corresponding value in the RHB pile (140.7 mg kg-TS-1 day-1; p<0.05). Averaged over the entire 58-day composting period, the RHB pile showed a 33.4% reduction in NH3 emissions compared to the CON (41.7 vs. 62. mg kg-TS-1 day-1), although this difference did not reach statistical significance (p=0.066). These findings suggest that biochar amendment effectively reduced NH3 emission, particularly during the middle composting stage when microbial activity and nitrogen mineralization are intense. According to Pereira et al. (2024), the application of biochar resulted in a notable 59% decrease in total NH3 emissions when compared with the untreated control. The researchers suggested that this significant mitigation effect was attributed to the biochar's improved capacity to adsorb ammoniacal nitrogen, which is related to its high specific surface area and considerable cation exchange capacity.
3. N2O Concentration and Emission Dynamics
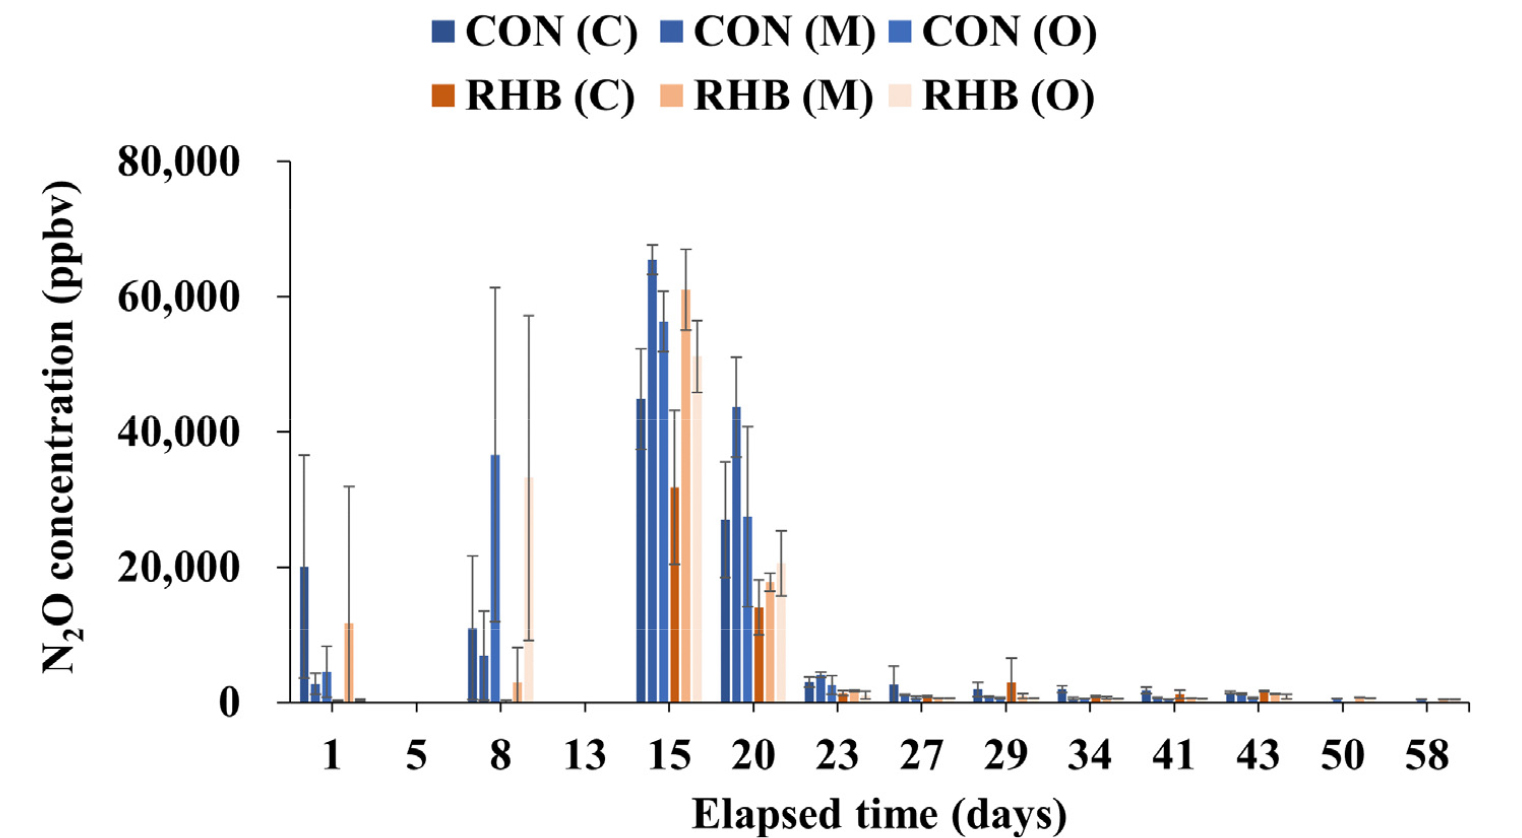
During the composting process, N2O concentrations within the piles exhibited notable spatial and temporal variation across center, middle, and outer sections (Figure 6). In general, both treatments showed elevated N2O levels during the early and mid-thermophilic phases, followed by a gradual decline toward the maturation stage. The maximum concentrations in the CON pile reached 44,877 ppbv (center), 65,456 ppbv (middle), and 56,319 ppbv (outer), whereas the RHB pile exhibited peaks of 31,810 ppbv, 61,006 ppbv, and 51,173 ppbv at corresponding positions. Despite some fluctuations, the RHB consistently maintained lower N2O concentrations than the CON, particularly during days 20-34. Statistically significant reductions in N2O concentrations were observed in the RHB pile on multiple days. At the center, significant differences were found on days 23 and 34 (p<0.05); at the middle, on days 20, 23, and 27 (p<0.05). These results indicate that the application of rice husk biochar effectively reduced N2O concentration, particularly during the thermophilic phase when nitrification-denitrification processes are likely to be active. Moreover, average N2O concentration reductions of 52.4% in the center section further support the biochar's mitigating effect. These reductions in N2O concentrations align with the observed oxygen profiles during the thermophilic phase. Specifically, oxygen concentrations in the RHB pile were frequently higher than those in the CON pile at the center and middle sections, particularly from days 20 to 27, when significant differences in N2O levels were also detected.
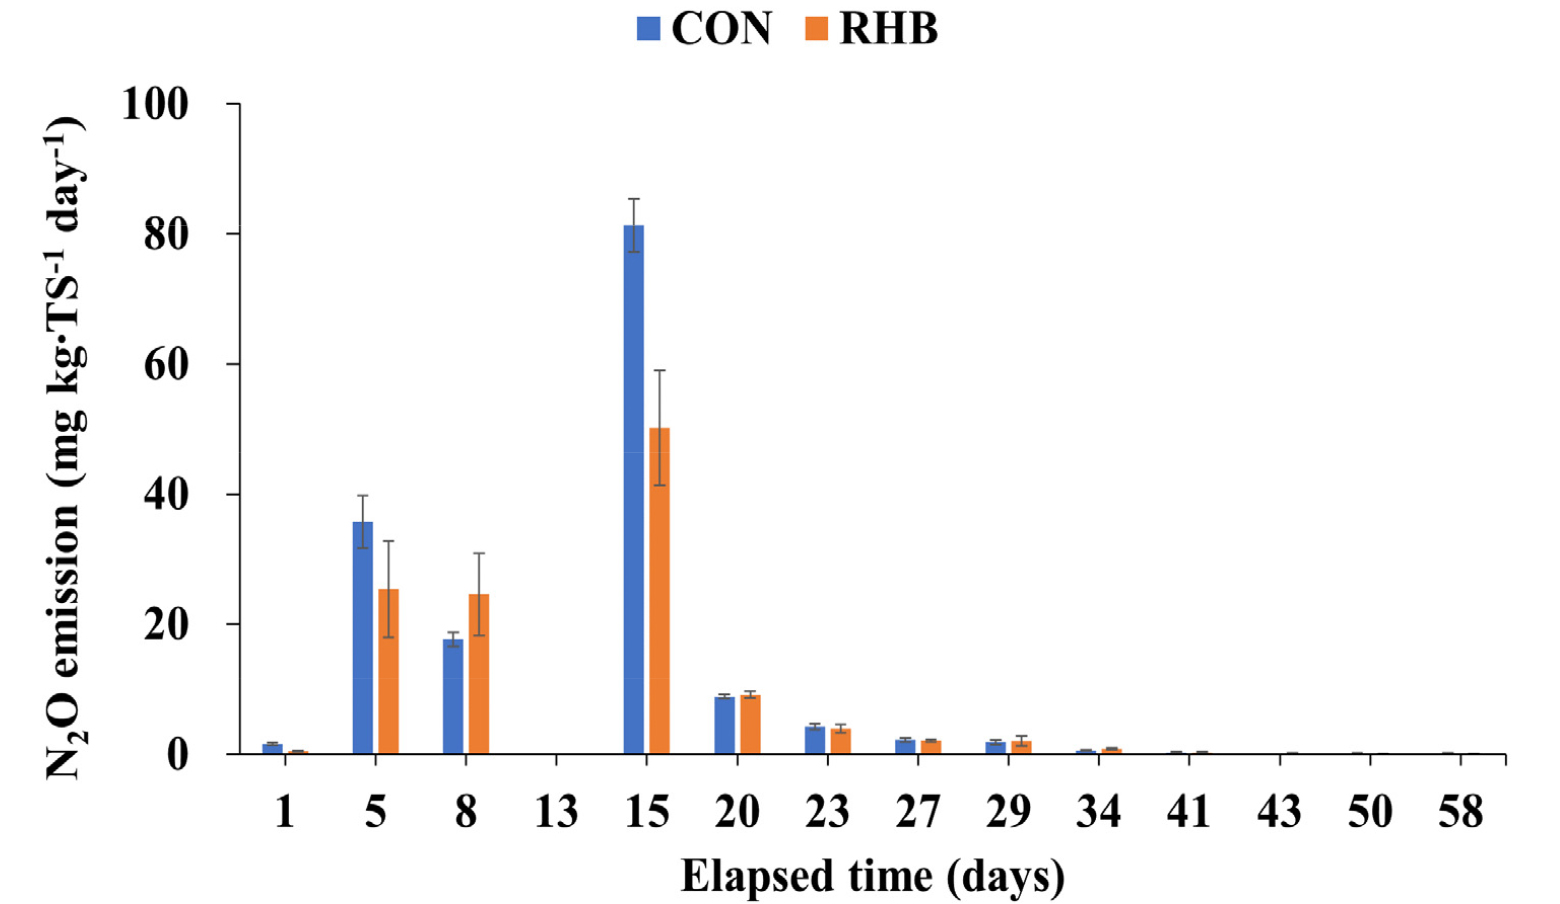
Biochar amendment influenced not only N2O concentrations but also its emissions throughout the composting period. As illustrated in Figure 7, the emission profiles of both CON and RHB treatments peaked on day 15, with the CON pile reaching 81.3 mg kg-TS-1 day-1 and the RHB pile exhibiting a 38.3% lower peak emission of 50.2 mg kg-TS-1 day-1 (p<0.05). When averaged over the composting period, the RHB pile emitted 9.9 mg kg-TS-1 day-1 of N2O, approximately 25.2% lower than the 13.2 mg kg-TS-1 day-1 from the CON pile (p<0.05). Studies have consistently shown that incorporating biochar into composting processes can mitigate N2O emissions. For example, Yuan et al. (2017) reported a 27% reduction in N2O emissions from biochar-amended chicken manure compost compared to the control. Similarly, Castro and Herrera et al. (2023) observed even greater reductions, finding that biochar addition decreased N2O emissions by 56-57% during the composting of both human excreta and cattle manure.
The observed reduction in N2O emissions from the RHB pile supports the role of biochar in mitigating these losses, likely by improving composting conditions that reduce anaerobic microsites, thereby suppressing the formation of N2O during incomplete denitrification. Since N2O are formed through the complex series of nitrification and denitrification processes, oxygen availability plays a critical role in regulating its formation (Sanchez et al., 2015). Although bulk oxygen levels in both treatments were not strictly anaerobic, aerobic and anaerobic zones coexist within the compost pile, creating a favorable environment for the formation of N2O. Therefore, the improved aeration observed in the RHB treatment likely helped reduce the extent of such microsites, thereby suppressing N2O formation from coupled nitrification- denitrification processes often occurring in these zones.
The incorporation of rice husk biochar during composting had a significant influence on nitrogen dynamics, particularly with regard to TN retention and mitigation of gaseous nitrogen losses. This observed mitigation of gaseous nitrogen losses in the RHB treatment can likely be attributed to several interacting mechanisms. First, biochar's porous structure likely facilitated greater NH4+ adsorption, reducing the potential for NH3 volatilization. Secondly, improved internal aeration within the RHB pile, as evidenced by significantly higher internal oxygen concentrations and a greater reduction in VS reflecting more vigorous aerobic activity, have constrained denitrification processes responsible for N2O production. These findings suggest that biochar contributed to a more stable and aerated compost environment, thereby preserving nitrogen while simultaneously reducing environmentally detrimental gaseous losses. As such, biochar not only promotes enhanced organic matter stabilization but also mitigates gaseous nitrogen losses, thereby improving the environmental performance of manure composting systems.
Conclusion
This pilot-scale study demonstrated the potential of rice husk biochar as an effective nitrogen-stabilizing amendment during the composting of Hanwoo bedded manure. Incorporating 10% rice husk biochar (dry weight) significantly enhanced volatile solids degradation, particularly during the thermophilic phase, suggesting improved microbial activity. Concurrently, the rice husk biochar treatment achieved a 33.4% and 25.2% reduction in NH3 and N2O emissions, respectively, compared to the control, and led to a 29% improvement in total nitrogen retention. These benefits are attributable to the porous properties of rice husk biochar. Its porous structure likely facilitated the adsorption of ammoniacal nitrogen, thereby reducing NH3 volatilization. In addition, the improved internal aeration promoted by biochar enhanced oxygen diffusion within the compost matrix. This likely reduced the formation of anaerobic microsites, which are favorable for denitrification. As a result, N2O formation was also mitigated. Overall, the results support the application of rice husk biochar as a dual-function amendment-promoting organic matter stabilization while simultaneously reducing nitrogenous gas losses during composting. Its use offers a practical and scalable strategy for reducing gaseous nitrogen losses and improving compost quality in Korean cattle manure management systems.
